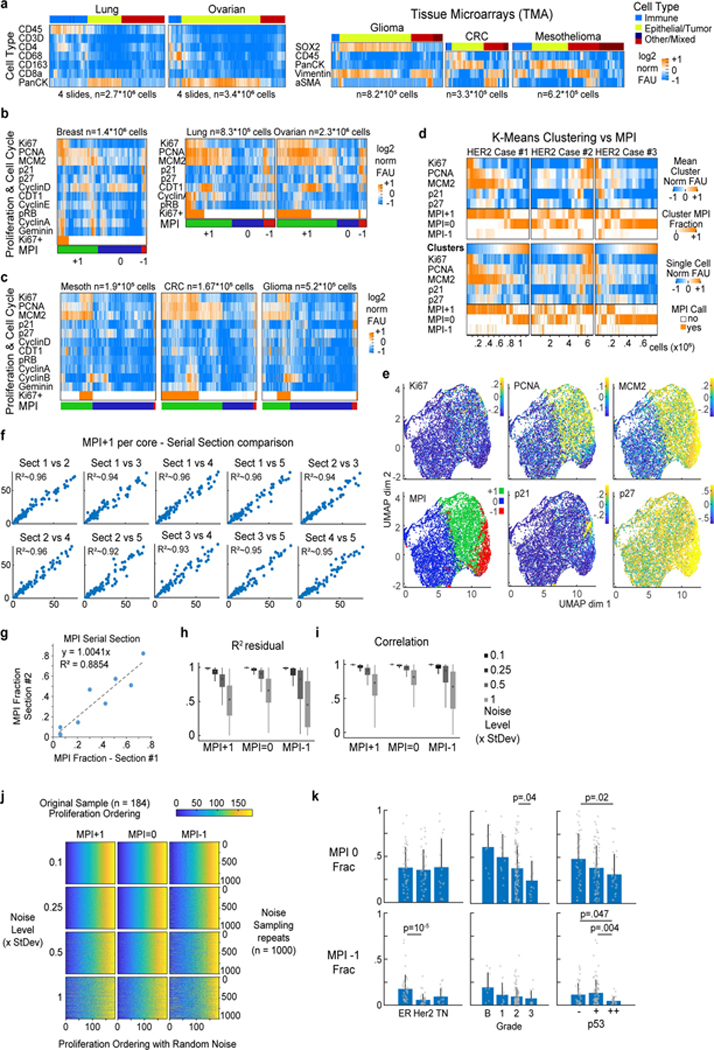
Extended Data Fig. 1: Multivariate Proliferation Index (MPI) in human cancer tissues.

a. Clustered heat map of log2 normalized cell lineage marker signal intensities on a per-cell basis derived from CyCIF images of 4 whole slides of lung squamous cell carcinoma (SCC) and ovarian carcinoma, and tissue microarrays (TMAs) from glioma, colorectal carcinoma (CRC) and mesothelioma. b-c. Clustered heat map of single-cell signal intensities of cell cycle markers for epithelial/tumor cells in Fig. 1a (breast carcinoma) and panel a. Ki-67+ cells were identified by normalization using Gaussian mixture modeling with 2 components. Multivariate Proliferation Index (MPI) indicated: +1 (proliferative, green), 0 (non-proliferative, blue), or −1 (arrested, red). d. K-means clustering heat map of five MPI markers for epithelial/tumor cells of three HER2+ breast cancer samples (k = 20 clusters), and heat map of single-cell normalized log2 intensities. In both, the corresponding MPI category is depicted for comparison (k-mean clustering fraction of MPI category is depicted). e. UMAP plots for 180 samples of breast carcinomas from the Cooperative Human Tissue Network (CHTN) Stage II TMAs (#14–17) with proliferation markers mapped to color (MPI categories were not used as UMAP variables, n = 10,000 cells). f. MPI robustness comparison between five sets of serially cut tissue sections from Pantomics TMA BRC15010 and g. between two sets of serially cut tissue sections of the 3 breast HER2-positive cases from Fig. 1c,e. Each dot represents the fraction of MPI +1 cells in the two indicated tissue sections (linear least-square fit with fixed origin at y=x=0). h-j. Permutation testing of breast carcinomas from the CHTN Stage II TMAs (#14–17, n = 180 samples) with MPI calculations performed by adding increasing amounts of normally distributed noise (0.1x, 0.25x, 0.5x and 1x standard deviations of original marker distribution) to the five MPI cutoffs, repeated 1000 times using i. linear regression, i. correlation analysis (boxplots: median, 25–75th percentile and min-max extremes from MatLab boxplot.m function), and j. intra-cohort ordering of MPI estimates. k. Comparison of MPI 0, and MPI −1 fractions in epithelial/tumor cells across different classifiers of breast cancer in Fig. 1g (n=142 samples, mean + SD, 2-sided KS p-values with 0.05 significance cutoff).
