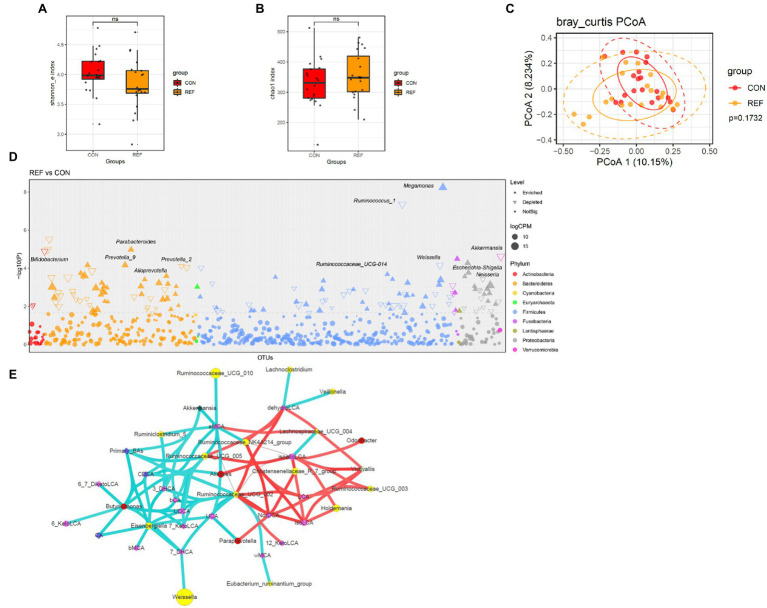
Figure 7.
Alterations of fecal bacterial microbiota profile. The alpha diversity, (A) Shannon index; (B) Chao1 index. *p < 0.05. (C) PCoA of bacterial beta-diversity based on Bray Curtis distance. (D) Bacterial genera with abundance differentiation in REF group compared with CON group in the Manhattan diagram. Differences between two groups were shown as point shape indicated ASV enriched, depleted or not significant; point size indicated the abundance of ASV. (E) Co-occurrence network of bile acids and microbiota. The dot size indicated the enrichment degree in the REF group (diamond) and the CON group (circle). The lines indicated the degree of positive (red) or negative (green) correlation. REF, bile reflux; CON, controls.

