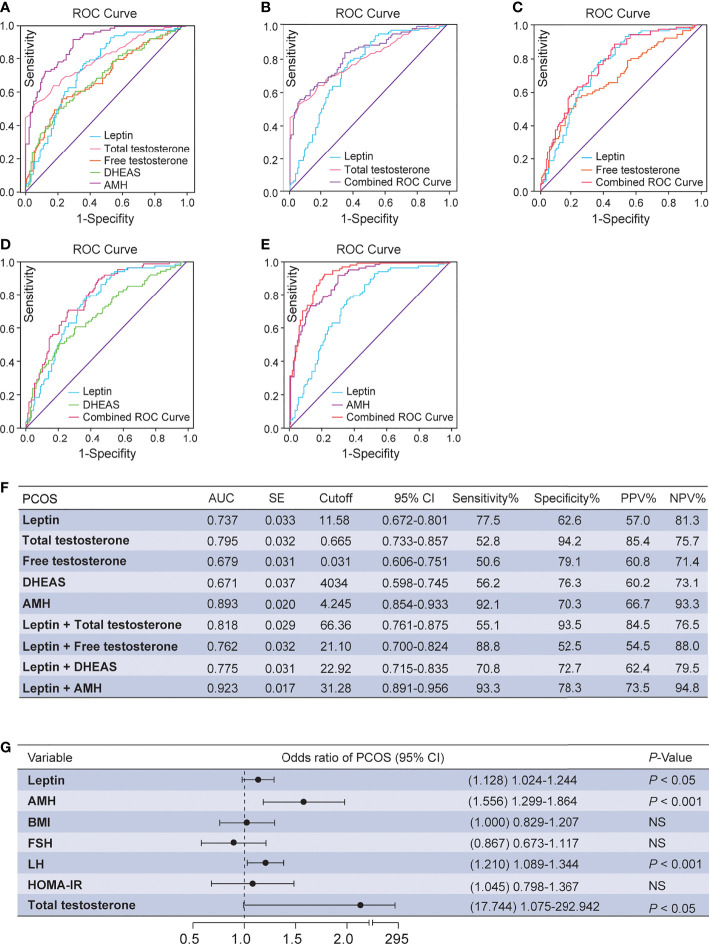
Figure 2.
ROC analysis and multivariate logistic regression between serum leptin and androgens. (A) Diagnostic potential of leptin, total testosterone, free testosterone, DHEAS and AMH for PCOS estimated using ROC analysis. (B) Combined curve of leptin with total testosterone. (C) Combined curve of leptin with free testosterone. (D) Combined curve of leptin with DHEAS. (E) Combined curve of leptin with AMH. (F) AUC, SE, cutoff value, 95% CI, Sen%, Spe%, PPV%, and NPV% of ROC curves. (G) Multivariate analysis with the following variables in the model: leptin, HOMA-IR, BMI, FSH, LH, total testosterone and AMH. DHEAS, dehydroepiandrosterone sulfate; PCOS, polycystic ovary syndrome; ROC, receiver operating characteristic; AUC, area under the curve; SE, standard error; 95% CI, 95% confidence interval; Sen%, sensitivity %; Spe%, specificity %; PPV, positive predictive value; NPV, negative predictive value; FSI, fasting serum insulin; BMI, body mass index; FSH, follicle-stimulating hormone; LH, luteinizing hormone; AMH, anti-Müllerian hormone; HOMA-IR, homeostasis model assessment of insulin resistance; NS, not significant.

