
Fig. 1.
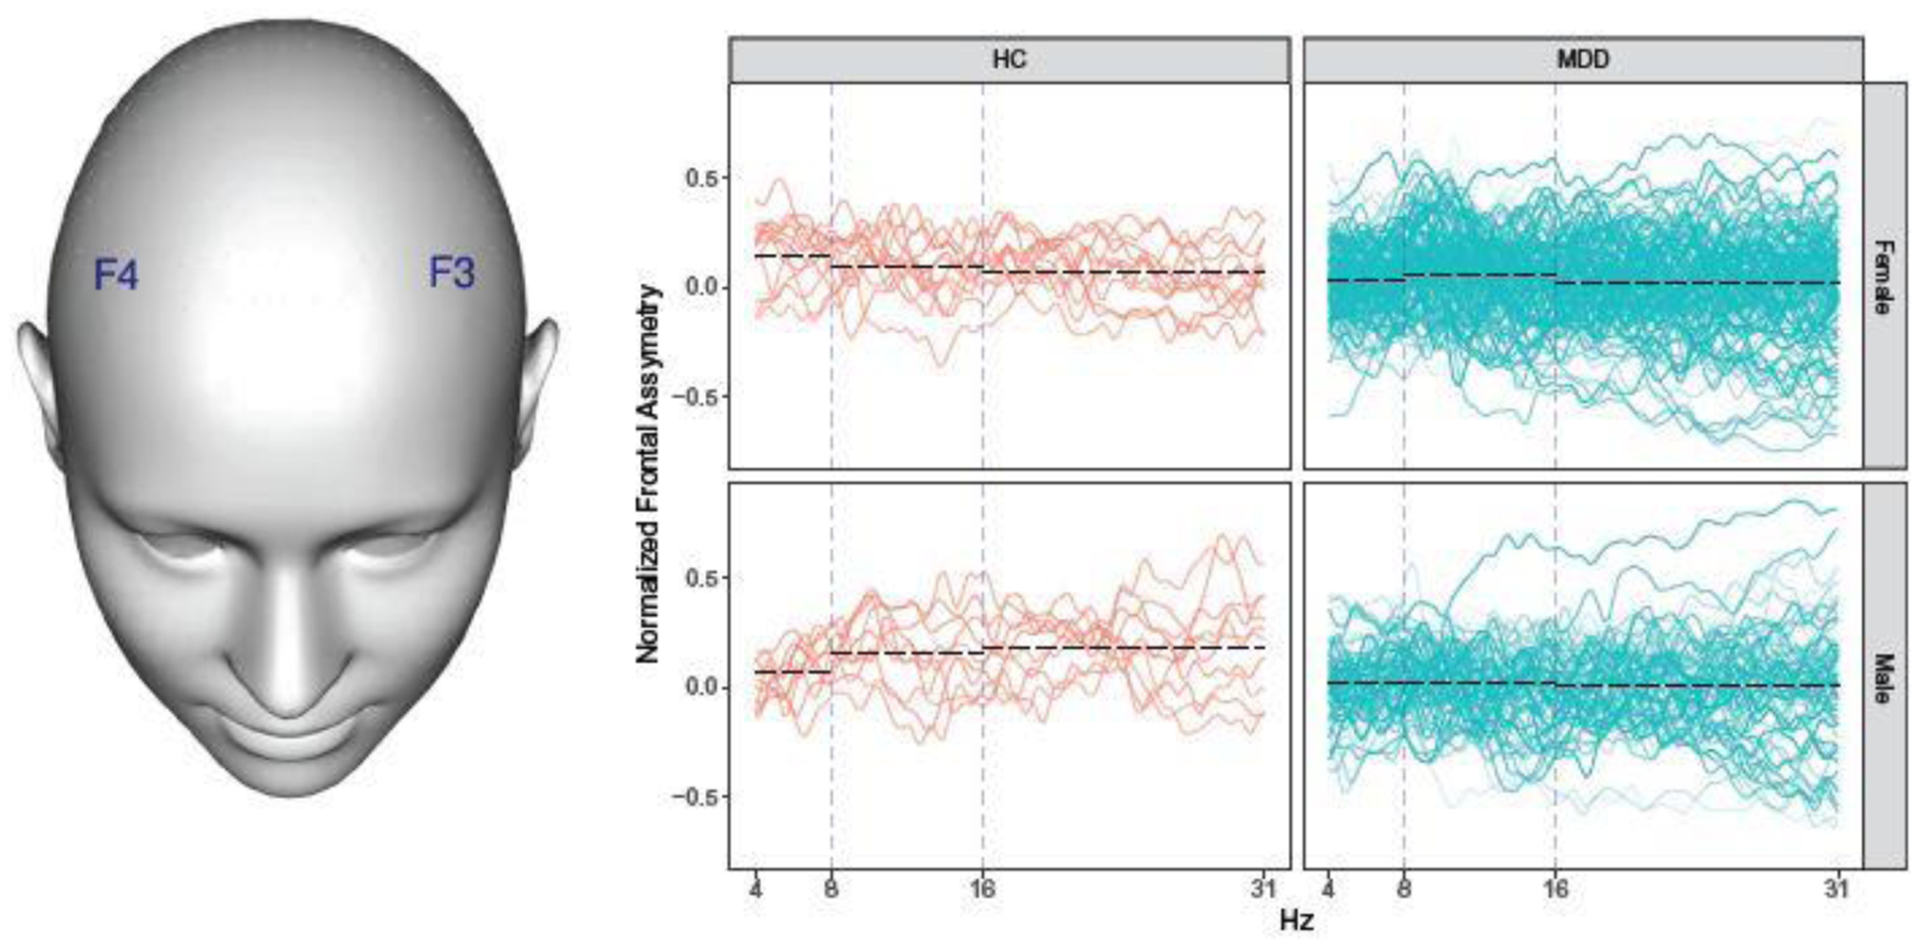
Left: Locations of F3 and F4 electrodes. Right: Normalized frontal asymmetry curves. HC = healthy control, MDD = major depressive disorder. Blue vertical dashed lines separate the theta (4 – 8 Hz), alpha (8 – 16 Hz), and beta (16 – 31 Hz) frequency bands. Black dashed lines show mean values within a frequency band.