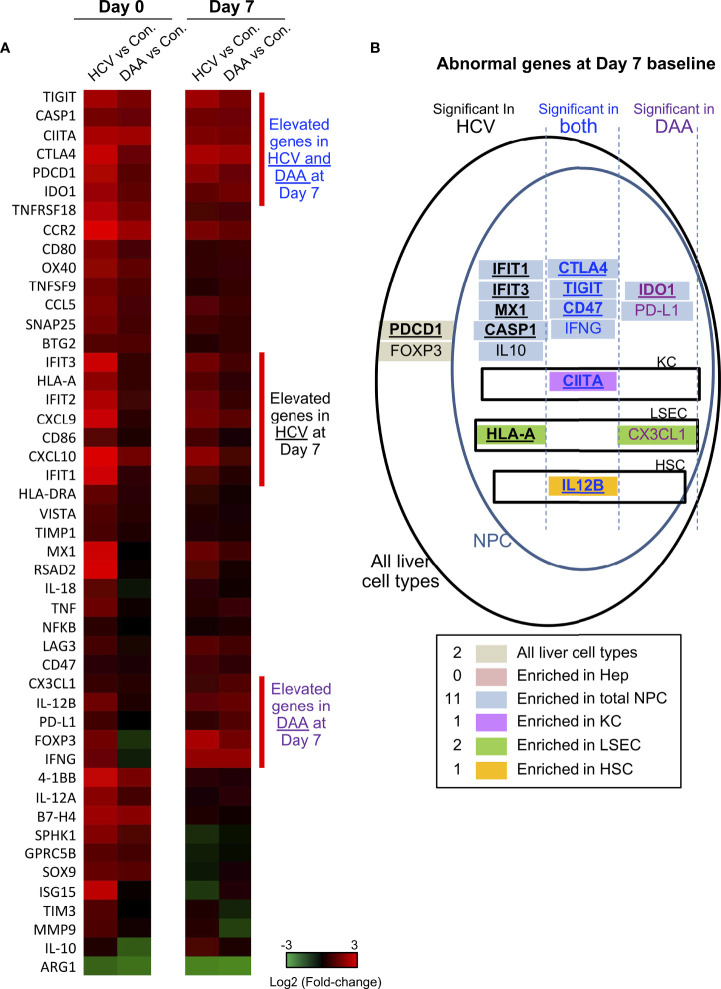
Figure 4.
Immune gene changes at the day 7 baseline in chronic HCV-infected and DAA-cured livers. (A) Hierarchical clustering of immune genes with statistically significant elevation in HCV or DAA-cured subjects at Day 0 or Day 7 time points. The group-level fold changes are shown, which were calculated with the mean Ct value of each gene within each patient group. Decreased fold changes are colored in green, and increased fold changes are colored in red. (B) The up-regulated genes in HCV and DAA-cured at day 7 time points. Genes were mapped to liver cell types according to the cell type analysis with day 0 non-infected livers. Genes are grouped by expression patterns in cell compartments and in specimen type. The overlapped genes up-regulated at both day 0 and day 7 time points are bolded and underscored.

