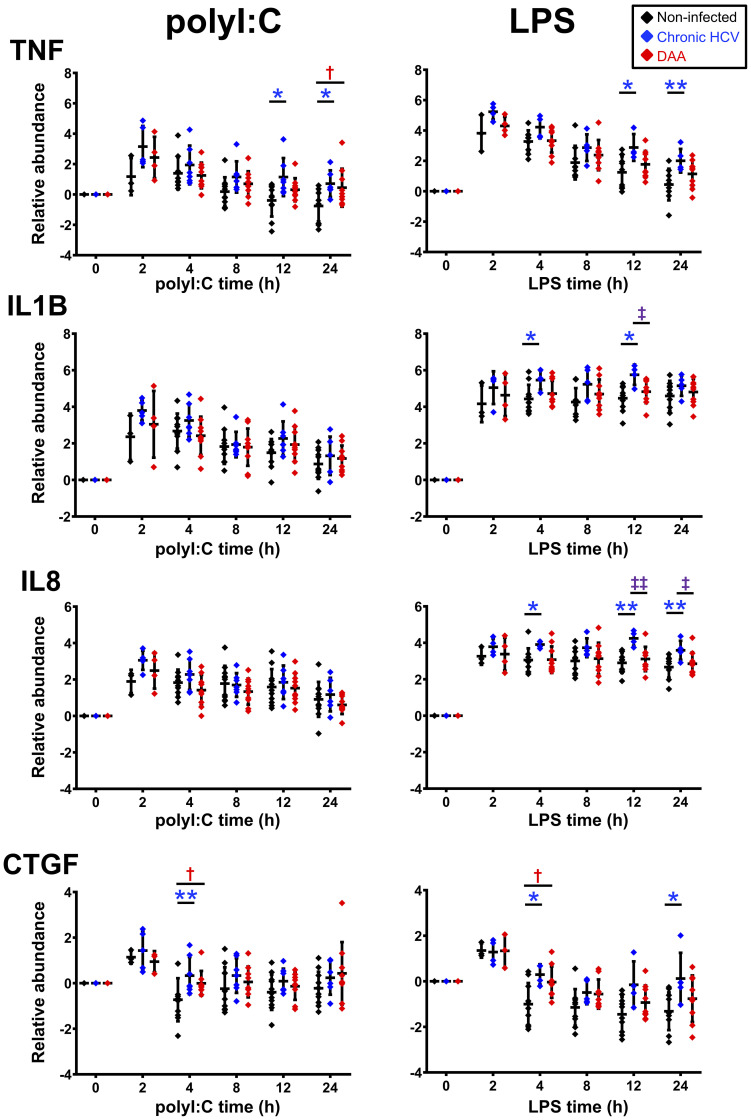
Figure 5.
Delta-delta Ct analysis showing up-regulated genes post- poly-I:C or LPS stimulation in chronic HCV-infected and DAA-cured liver slices. The relative gene abundance was normalized to to the arithmetic mean of Ct values of ACTB, GAPDH and HPRT1. The relative abundance was further normalized to the day 7 time zero measurements. Statistical significance was based on two-tailed Mann-Whitney test. *, statistical significantly different between non-infected versus chronic HCV liver slices. †, statistical significantly different between non-infected versus DAA-cured liver slices. ‡, statistical significantly different between chronic HCV versus DAA-cured liver slices. Levels of statistical significance are indicated thus: *P < 0.05 **P < 0.01. The mean and standard deviation within each group are plotted.

