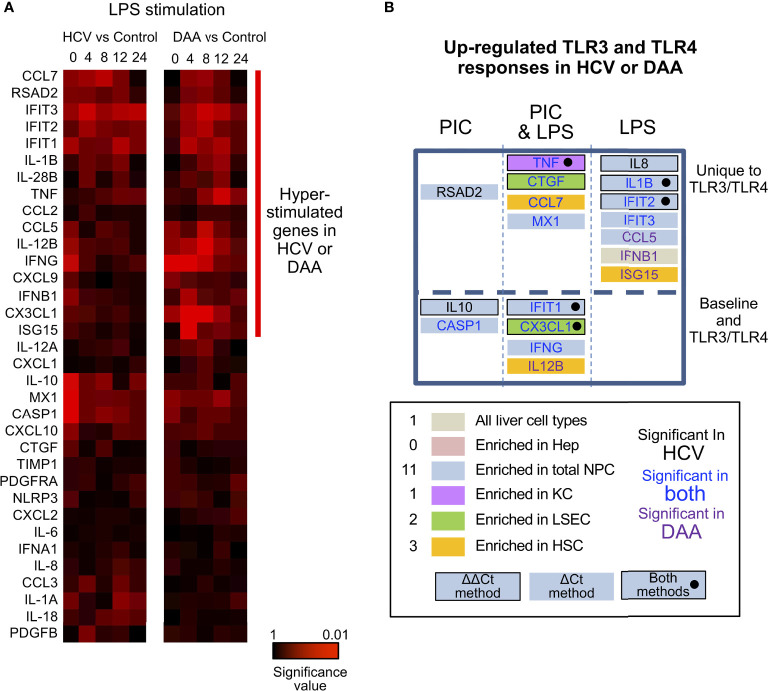
Figure 6.
Altered TLR3 and TLR4 response in chronic HCV-infected liver slices not restored in DAA-cured liver slices. (A) Hierarchical clustering of immune responsive genes with 2-fold or greater induction during LPS stimulation. The statistical significance P value with ΔCt method is shown. Gene abundance of individual liver slices was normalized to the arithmetic mean of Ct values of ACTB, GAPDH and HPRT. Two-tailed Mann-Whitney test was used. Greater significance P value is colored with darker red. (B) Genes up-regulated with P < 0.05 at one time point in either poly-I:C or LPS treatment were included as up-regulated genes. Genes boxes were colored with the enriched expression in cell compartment of day 0 information. Using the ΔΔCt method, genes that increased in expression during TLR3/TLR4 response are highlighted with a black bordering; genes shown to increase based on both ΔΔCt and ΔCt methods are highlighted with black bordering and black solid circles. Genes names are colored by in HCV- or DAA- samples or both. These genes were further grouped by whether they were differentially expressed in TLR3 or TLR4 treatment not at the baseline level, and whether poly-I: C or LPS treatment revealed differential responses.

