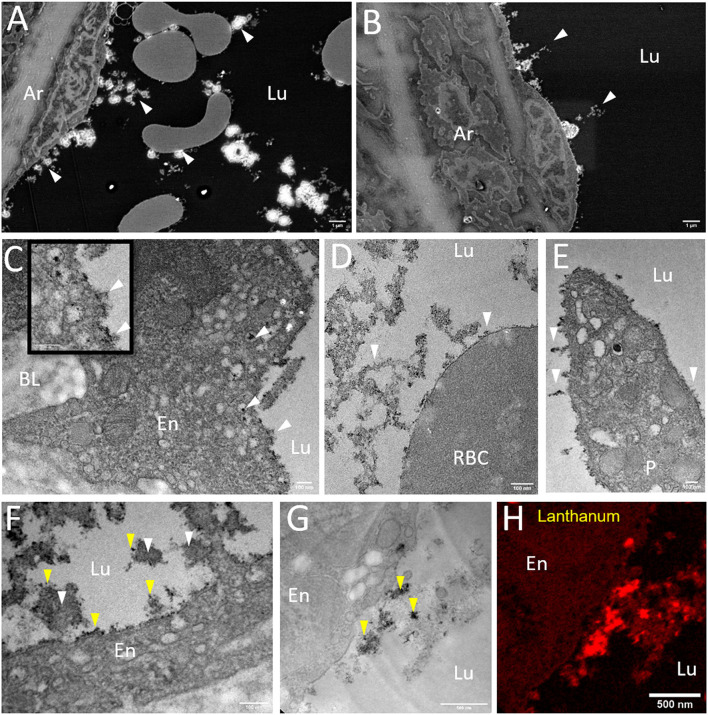
Figure 5.
Morphology of the glycocalyx under IR-CPB conditions imaged by EM combined techniques. (A,B) Overview micrographs acquired by SEM observations on resin embedded ultrathin sections (scale bar: 1 μm). (C–F) Higher resolution TEM images showing the glycocalyx weakly developed at the endothelium, red blood and platelet surface (scale bar = 100 nm). (F) Presence of large components (white arrows) in luminal space reacting with lanthanum salt (yellow arrows) as shown by EFTEM imaging (G,H) scale bar = 0.5 μm. Ar, Artery; BL, Basal Lamina; En, Endothelium; Lu, Lumen; P, Platelet; RBC, Red Blood Cell.

