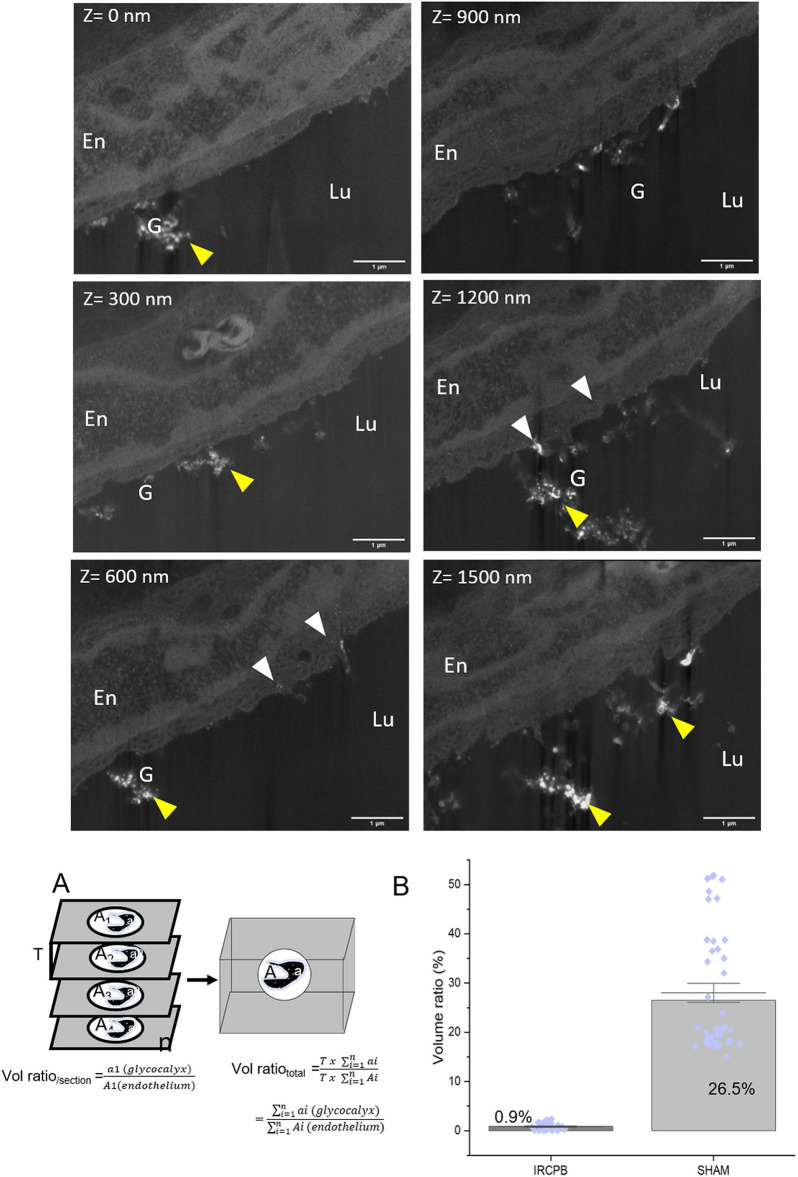
Figure 6.
Tomography 3D FIB-SEM under IR-CPB conditions: Micrographs extracted from FIB-SEM stack at different z-position. Stack images were acquired from 30 ≪ slice and view ≫ images with a step of 50 nm. Glycocalyx (G) (yellow arrows) appears as white material at the endothelial surface (En). White arrows point endothelial vesicles filled with glycocalyx. Note the low density of glycocalyx at the endothelial surface; scale bar = 1μm. Quantitative estimation of glycocalyx volume was done using the Cavalieri method schematized in (A); Data are normalized with endothelium volume. Bar graph (B) represents the glycocalyx volume ratio when the whole 3D tomogram is considered, and blue dots illustrate the dispersion of the glycocalyx volume ratio for each FIB-SEM-section (n = 31 and 40, respectively for IR-CPB and sham).

