. 2022 Mar 15;11:e67549. doi: 10.7554/eLife.67549

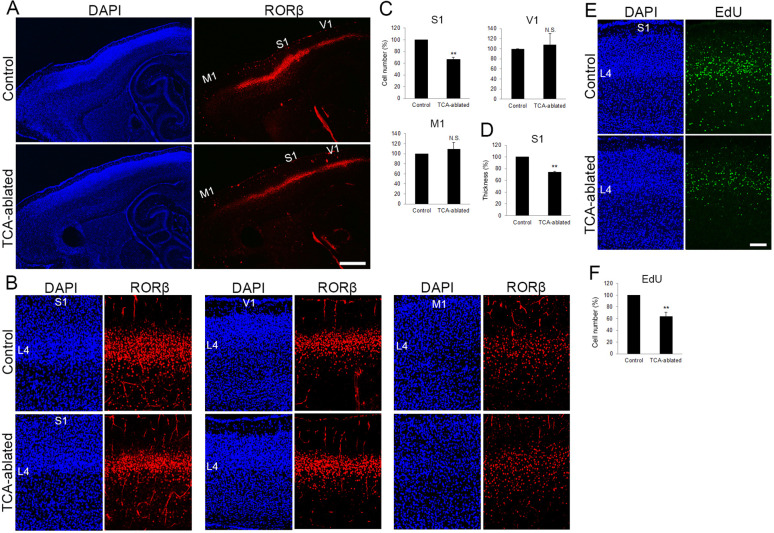
Figure 2. The number of layer 4 neurons is reduced in S1.

(A) Sagittal sections of P7 cortices derived from thalamocortical axon (TCA)-ablated mice stained with RORC antibody. Expression of the layer 4 marker RORβ was declined, specifically in S1, resulting in poorly demarcated borders between adjacent areas. (B) Coronal section of the cortex of a TCA-ablated mouse at P7, showing RORβ-expressing layer 4 (L4) neurons in S1. (C) Quantification of RORβ expression. RORβ-expressing cells within an 850-μm-wide strip of the cortical wall were counted. Note that the number of RORβ-positive cells was less in S1, but was not changed in V1 and M1, in TCA-ablated mice. Data are presented as a percentage of control mice (mean ± standard error of the mean [SEM]): S1, 66.75 ± 3.30%, N = 7 mice, p = 0.0011; V1, 108.28 ± 22.00%, N = 5 mice, p = 0.656; M1, 109.47 ± 12.97%, N = 4 mice, p = 0.878; Mann–Whitney U test, **p < 0.01. The same numbers of control and experimental animals were used. (D) Thickness of RORβ-expressing layer was also reduced in TCA-ablated mice. Data are presented as a percentage of control mice (mean ± SEM): 73.69 ± 1.83%, N = 7 mice, p = 0.0011; Mann–Whitney U test, **p < 0.01. (E) Cross-sections of S1 cortices of control and TCA-ablated mice at P7, showing distribution of EdU-positive cells. EdU was injected at E14.7. (F) Quantification of the results. The number of EdU-positive cells within an 850-μm-wide strip of the cortical wall relative to control is shown as the mean ± SEM: 64.37 ± 6.77%, p = 0.0075; Mann–Whitney U test, **p < 0.01, N = 5 animals for both control and TCA-ablated mice. L4, layer 4; M1, motor area; S1, primary somatosensory area; V1, primary visual area. Scale bars, 500 μm (A), 100 μm (B, E).

Figure 2—source data 1. Raw data of C, D, F.

Figure 2.

Figure 2—figure supplement 1. Effects of thalamocortical axon (TCA) ablation on the number of neurons in L2–5 and Cux1-positive upper layer neurons.
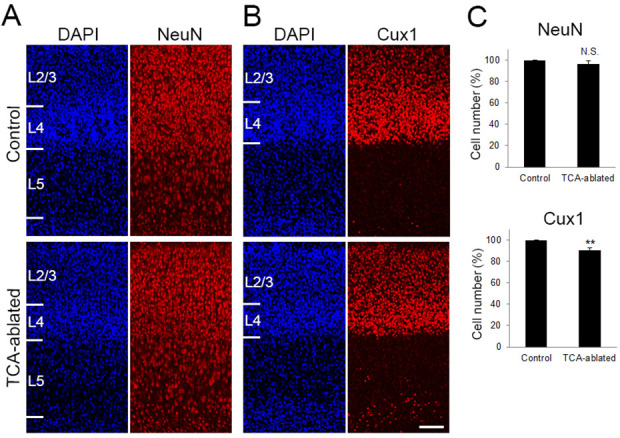
Figure 2—figure supplement 1.

(A, B) Cross-sections of S1 area of P7 control and TCA-ablated mice, stained for DAPI, NeuN (A), and Cux1 (B). (C) Quantification of the results. Ratio of the number of cells in TCA-ablated mice to control mice is presented as mean ± standard error of the mean (SEM): NeuN-positive cell, 96.40 ± 2.95%, N = 14 sections from 4 mice for each, p = 0.282; Cux1-positive cell, 90.50 ± 2.12%, N = 26 sections from 7 mice for each, p = 0.0011; Mann–Whitney U test, **p < 0.01. Neurons in layer 6 were not counted as they express Cre in 5HTT-Cre mice. L2/3, layers 2 and 3; L4, layer 4; L5, layer 5. Scale bar, 100 μm.
Figure 2—figure supplement 1—source data 1. Raw data of C.
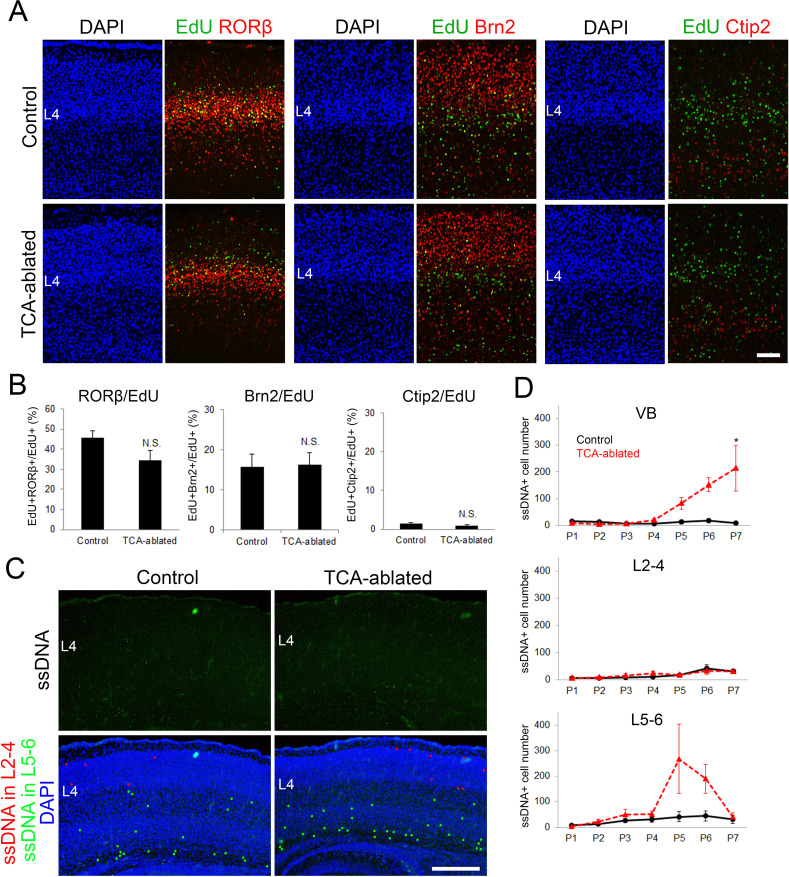
Figure 2—figure supplement 2. Effects of thalamocortical axon (TCA) ablation on cell fate and cell death of layer 4 neurons in S1.

Figure 2—figure supplement 2.

(A) Cross-sections of S1 cortex of control and TCA-ablated mice to which EdU had been administrated at E14.7, stained for EdU and layer markers, RORβ, Brn2, and Ctip2. (B) Quantification of the results. Percentage of EdU-labeled cells with a given layer marker is presented as the mean ± standard error of the mean (SEM): RORβ/EdU, 45.87 ± 3.15% (control), 34.56 ± 4.88% (TCA-ablated), N = 26 sections from 7 mice for each, p = 0.128; Brn2/EdU, 15.82 ± 3.04% (control), 16.28 ± 2.99% (TCA-ablated), N = 16 sections from 5 mice for each, p = 1.00; Ctip2/EdU, 1.42 ± 0.36% (control), 0.990 ± 0.19% (TCA-ablated), N = 16 sections from 4 mice for each, p = 0.686; Mann–Whitney U test. (C) Coronal sections of S1 cortex of control and TCA-ablated mice at P4, stained for ssDNA. Stained cells in layers 2–4 and 5–6 are represented as red and green dots, respectively, in the DAPI-stained image. (D) Quantification of the results. The number of ssDNA-positive cells in VB, layers 2–4, and layers 5–6 through P1–7 is presented as mean ± SEM: VB, P1, 15.0 ± 4.36 (control, N = 6 sections from 3 mice), 10.0 ± 2.00 (TCA-ablated, N = 4 sections from 2 mice); P2, 14.3 ± 6.17 (control), 4.67 ± 1.45 (TCA-ablated), N = 6 sections from 3 mice for each; P3, 5.67 ± 1.86 (control), 6.33 ± 3.18 (TCA-ablated), N = 5 sections from 3 mice for each; P4, 7.33 ± 2.91 (control), 20.67 ± 5.81 (TCA-ablated), N = 5 sections from 3 mice for each; P5, 12.67 ± 7.86 (control), 82.67 ± 21.46 (TCA-ablated), N = 4 sections from 3 mice for each; P6, 17.0 ± 5.51 (control), 152.3 ± 24.9 (TCA-ablated), N = 6 sections from 3 mice for each; P7, 9.75 ± 2.17 (control), 213.8 ± 85.0 (TCA-ablated), N = 8 sections from 4 mice for each, p = 0.0286; layers 2–4, P1, 7.33 ± 0.67 (control, N = 12 sections from 3 mice), 6.00 ± 1.00 (TCA-ablated, N = 8 sections from 2 mice); P2, 5.33 ± 2.40 (control), 9.00 ± 2.00 (TCA-ablated), N = 12 sections from 3 mice for each; P3, 7.67 ± 0.33 (control), 16.0 ± 6.93 (TCA-ablated), N = 11 sections from 3 mice for each; P4, 11.0 ± 3.21 (control), 23.7 ± 6.06 (TCA-ablated), N = 9 sections from 3 mice for each; P5, 16.4 ± 2.70 (control), 16.4 ± 4.64 (TCA-ablated), N = 8 sections from 3 mice for each; P6, 41.0 ± 13.4 (control), 33.0 ± 12.3 (TCA-ablated), N = 13 section from 4 mice for each, p = 0.686; P7, 31.25 ± 7.69 (control), 31.25 ± 6.29 (TCA-ablated), N = 16 sections from 4 mice for each, p = 0.8846; layers 5–6, P1, 7.33 ± 0.88 (control, N = 12 sections from 3 mice), 3.50 ± 1.50 (TCA-ablated, N = 8 sections from 2 mice); P2, 12.3 ± 2.96 (control), 22.7 ± 8.11 (TCA-ablated), N = 12 sections from 3 mice for each; P3, 26.6 ± 6.95 (control), 49.6 ± 20.2 (TCA-ablated), N = 11 sections from 3 mice for each; P4, 30.3 ± 9.84 (control), 52.3 ± 11.3 (TCA-ablated), N = 9 sections from 3 mice for each; P5, 41.3 ± 19.8 (control), 268.0 ± 135.7 (TCA-ablated), N = 9 sections from 3 mice for each; P6, 44.3 ± 20.3 (control), 190.3 ± 56.8 (TCA-ablated), N = 13 sections from 4 mice for each, p = 0.0571; P7, 31.5 ± 15.6 (control), 40.5 ± 16.0 (TCA-ablated), N = 16 sections from 4 mice for each, p = 0.343; Mann–Whitney U test, *p < 0.05. The number of ssDNA-positive cells in VB and layers 5–6 was increased in TCA-ablated mice consistent with Cre expression in these regions, whereas that in layers 2–4 was not throughout the period. L2–4, layers 2–4; L4, layer 4; L5–6, layers 5–6; VB, ventrobasal nucleus. Scale bars, 100 µm (A), 500 µm (C).
Figure 2—figure supplement 2—source data 1. Raw data of B, D.
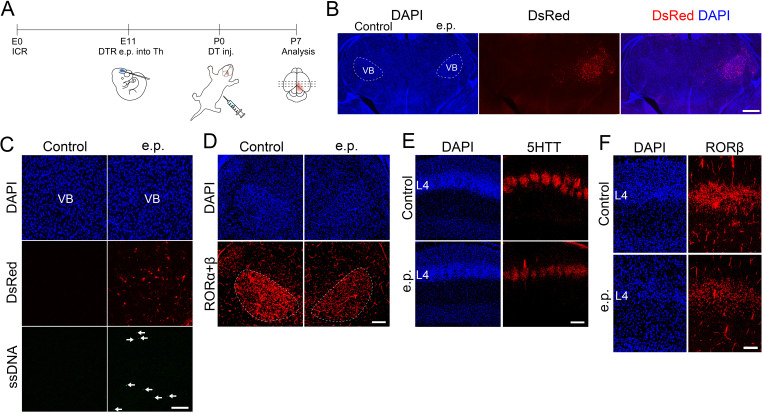
Figure 2—figure supplement 3. Electroporation-based thalamocortical axon (TCA) ablation causes reduction in the number of layer 4 neurons.

Figure 2—figure supplement 3.

(A) Schematic representation of the experimental procedure used for electroporation-mediated thalamic ablation. DTR-encoding plasmid together with DsRed plasmid was electroporated into the thalamus of E11.5 ICR mice. DT was administrated at P0 and brains were collected at P7. Coronal sections of thalamus specimens of electroporated mice at P7 (B, D) and P2 (C). VB neurons were preferentially electroporated, as shown by DsRed fluorescence on the electroporated (e.p.) side of the thalamus at P7 (B). Upon administration of DT at P0, a number of ssDNA-positive dying cells (arrows in C) were detected on the e.p. side, where residual DsRed-expressing cells are visible at P2. RORC-immunostaining revealed a reduction in RORα+β-expressing neuron in the VB on the e.p. side at P7 (D). Coronal sections of S1 cortex of a DTR-electroporated specimen to which DT was administrated at P0, stained for 5HTT (E) and RORβ (F). 5HTT immunoreactivity (E), and the cell density of RORβ-expressing cells (F) were decreased in layer 4 on the e.p. side. L4, layer 4; VB, ventrobasal nucleus. Scale bars, 500 µm (B), 200 µm (C–E), 100 µm (F).