Figure 1.

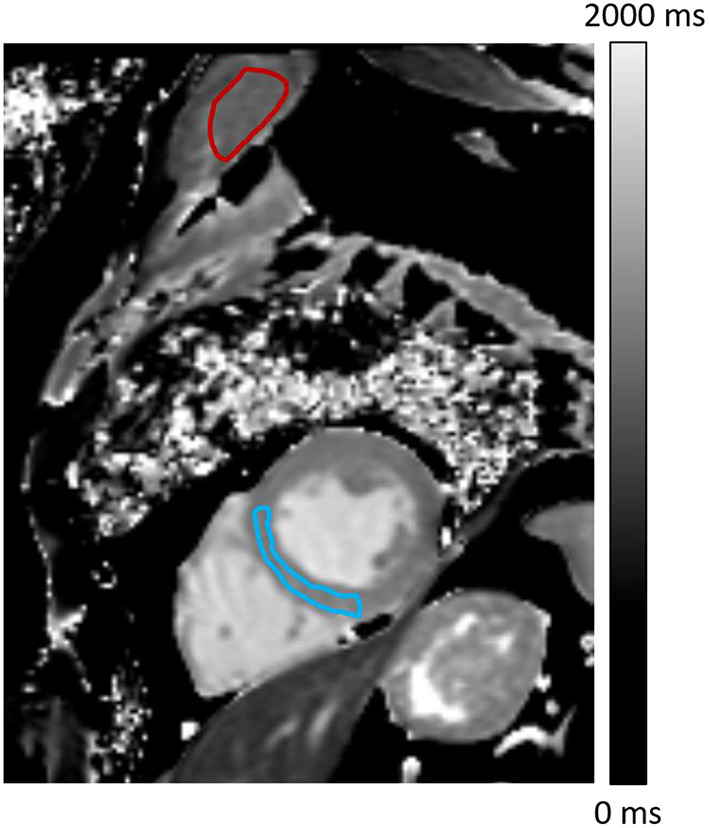
Pre-contrast T1 map showing regions-of-interest (ROIs) drawn to determine ECV and relaxation times on the myocardium (blue) and shoulders skeletal muscle (red).

Pre-contrast T1 map showing regions-of-interest (ROIs) drawn to determine ECV and relaxation times on the myocardium (blue) and shoulders skeletal muscle (red).