Figure 3.

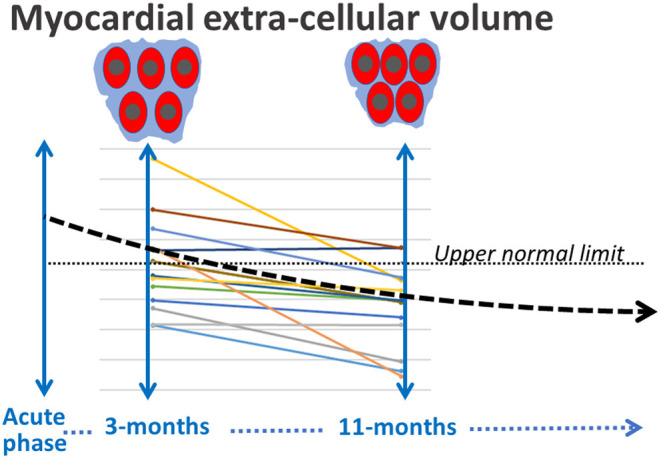
Schematic representation of the progressive decrease during the first year of the myocardial ECV, presumably in line with a delayed resolution of the interstitial edema.

Schematic representation of the progressive decrease during the first year of the myocardial ECV, presumably in line with a delayed resolution of the interstitial edema.