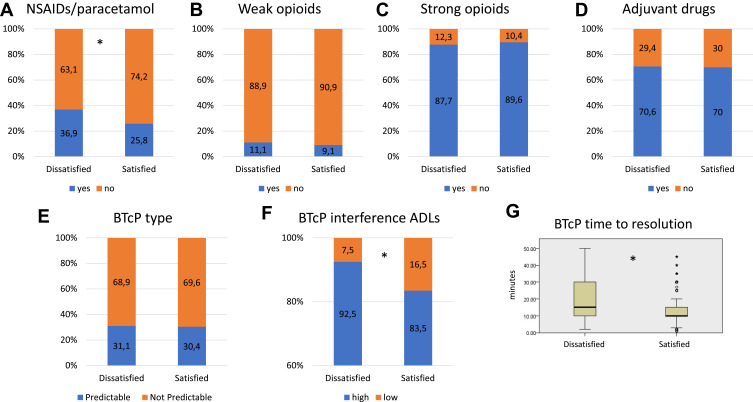
Figure 2.
Stacked bar charts exploring distribution in percentage of different type of patients’ therapy for background pain, eg, NSAIDs/paracetamol (A), weak opioids (B), strong opioids (C), and adjuvant drugs (D), among the two groups of interests (dissatisfied vs satisfied). Stacked bar charts of distribution in percentage of predictable vs not predictable BTcP (E) and high or low interference of BTcP in ADLs (F) among the two groups of interests (dissatisfied vs satisfied). (G) Box plot for time of BTP resolution among the two groups. Asterisks indicate statistically significant differences (p<0.05).
Abbreviations: BTcP, breakthrough cancer pain; ADLs, activities of daily living.

