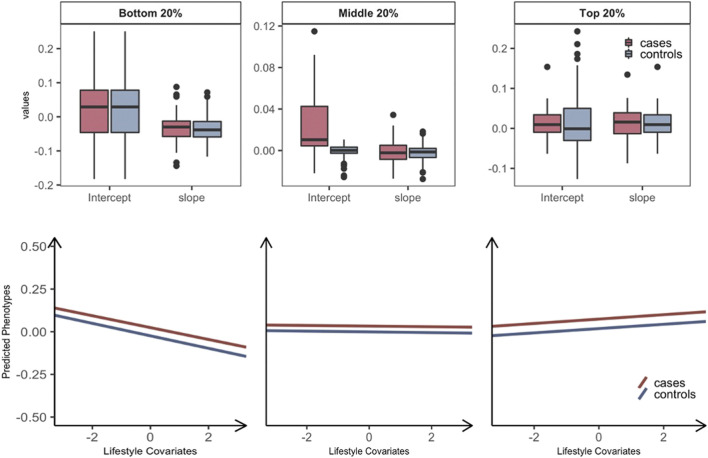
FIGURE 2.
Plasticity of diabetes-related metabolic traits of 69 significant overall interactions in response to the level of lifestyle effects by grouping T2DM prospective cases and controls. Individuals are stratified into three groups: the bottom, middle, and top 20% groups according to estimated GxE and RxE interactions from the full model (i.e., ). We further classified individuals into T2DM prospective cases (red) and controls (blue) in each of three groups, hence, six groups in total. To compare the differences in trajectories between with T2DM cases and controls, a linear model regressing the phenotype of main trait on standardized lifestyle measures was used to estimate the intercept and slope for each of six groups. The values of intercepts and slopes were averaged over the 69 analyses that showed significant signals for both GxE and RxE interactions. The averaged values of intercepts and slopes represent the overall relationship between metabolic risk and lifestyle covariates, where we considered making favorable and unfavorable directions consistent across the main trait and covariates to facilitate a better interpretation in line with metabolic risks on T2DM (see Methods). Boxplots for each group are represented to show the differences in terms of the calculated intercepts and slopes, and the mean of values for intercepts and slopes were represented as regression lines. The mean and standard error of intercepts and slopes across the analyses of the 69 pairs with significant overall interactions were estimated to assess if there is any significant difference of the mean between cases and control in each of the three groups: the bottom, middle, and top 20% groups. There were no significant differences between cases and controls in the mean of slopes in all three groups. The mean of intercepts is significantly different between cases and controls in all three groups (p-values = 2.25E-07, 6.98E-10, and 1.68E-09). The arrows on both axes in linear regression figures indicate an unfavorable direction in regard to T2DM health.

