
FIGURE 1.
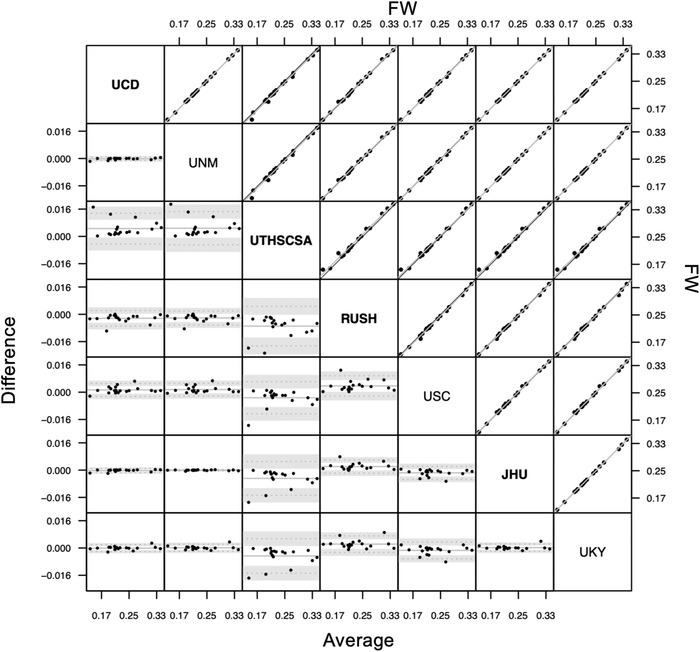
Bland‐Altman plot (lower triangle panel) and scatterplot (upper triangle panel) with identity and linear regression line (black and gray, respectively) of free water (FW) measures obtained from different sites (inter‐rater reliability study) in n = 19 participants. Bold or plain font for site's name indicate that sites used similar preprocessing methods (see Discussion section). JHU, Johns Hopkins University School of Medicine; RUSH, Rush University Medical Center/Illinois Institute of Technology; UCD, University of California Davis; UKY, University of Kentucky; UNM, University of New Mexico Health Sciences Center; USC, University of Southern California; UTHSCSA, University of Texas Health Science Center at San Antonio