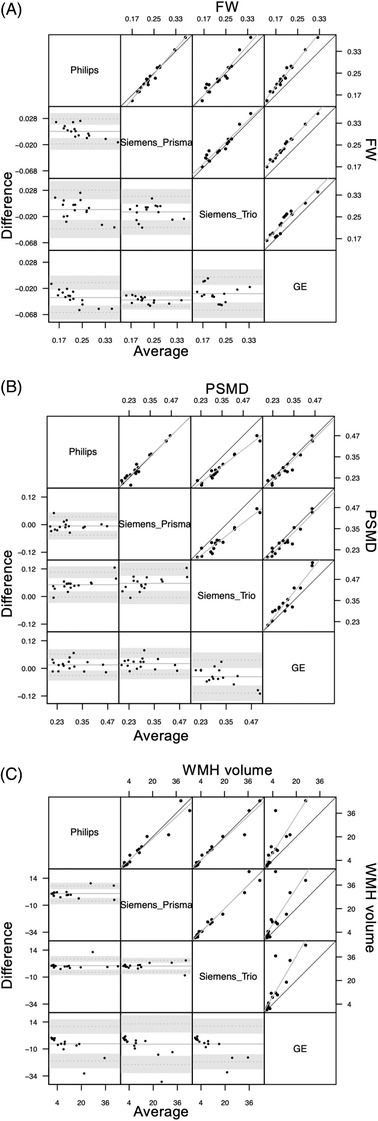
FIGURE 5.

Bland‐Altman plot (lower triangle panel) and scatterplot (upper triangle panel) with identity and linear regression line (black and gray, respectively) of (A) free water (FW), (B) peak width skeletonized mean diffusivity (PSMD), and (C) white matter hyperintensity (WMH) volumes obtained at two different sessions (inter‐scanner reproducibility study) in n = 20 participants. Gray background is used for comparisons that involve General Electric interpolated data
