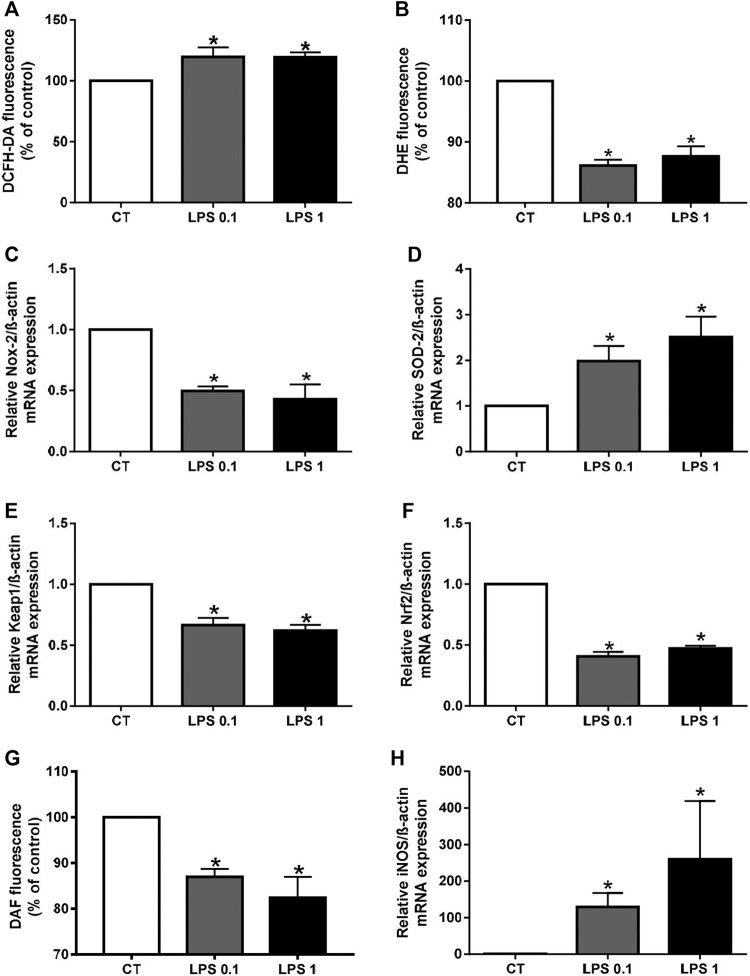
FIGURE 2.
Lipopolysaccharide-EK (LPS-EK) induces oxidative stress in macrophages. ROS (A), O2•– (B), and NO (G) production in RAW cells was measured using the fluorescent probes DCF, DHE, and DAF, respectively. Gene expression of (C) Nox-2, (D) SOD-2, (E) Keap1, (F) Nrf2, and (H) iNOS was quantified by quantitative real-time PCR and normalized to that of the housekeeping gene ß-actin. Data are expressed as the mean ± SEM of four independent experiments performed in triplicate (n = 4). *p < 0.05 vs. CT, Mann-Whitney test. LPS 0.1: 0.1 µg/ml LPS-EK, LPS 1: 1 µg/ml LPS-EK.

