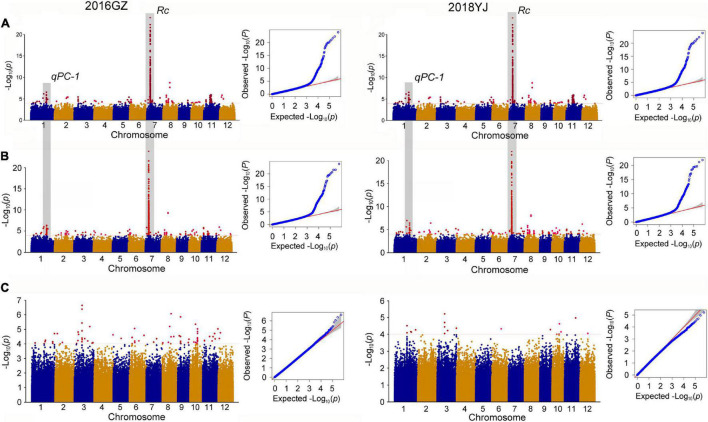
FIGURE 2.
Genome-wide association study for PC. (A,B) Manhattan plots of GWAS in 12 chromosomes and QQ plots of p-values conducted in the whole population using the PA and DPC phenotyping method, respectively. PA method, pericarp color were evaluated based on presence or absence of pigmentation; DPC method, pericarp color were evaluated based on the degree of pericarp color (DPC) using the visual card with scores of 1–7. (C) Manhattan plots of GWAS in 12 chromosomes and QQ plot of p-value conducted in the colored population.

