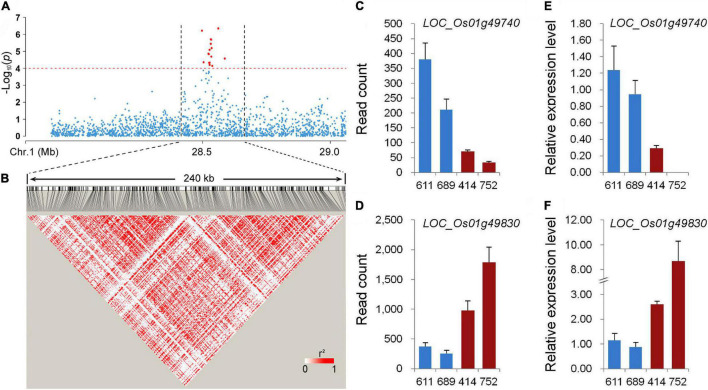
FIGURE 3.
Candidate gene analysis of qPC-1. (A) Local Manhattan plot of GWAS for qPC-1. (B) Linkage disequilibrium (LD) heatmap around the peak. (C,E) The expression of LOC_Os01g49740 in lines with white pericarp (accessions 611 and 689) and red pericarp (accessions 414 and 752) measured using RNA-seq and qRT-PCR, respectively. (D,F) The expression of LOC_Os01g49830 in lines with white and red pericarp measured using RNA-seq and qRT-PCR, respectively.

