

Abstract
The purpose of this paper is to develop an analytical framework for estimating the behavioral effects of disasters and their economic consequences. The reduction of these losses represents the benefits of pre-disaster mitigation and post-disaster recovery. We provide conceptualizations, definitions, classifications, and a formal welfare analysis of this category of economic consequences. We also examine methods used to measure behavioral reactions to fear for insight into improving their delineation. Because we are interested in a comprehensive assessment of behavioral effects, we also include resilience adjustments and extend our initial partial equilibrium analysis to the general equilibrium level. The analysis is intended to serve as the basis for the legitimate inclusion of behavioral consequences of disasters in benefit-cost analysis.
Keywords: Disasters, Behavioral responses, Economics consequences, Benefit-cost analysis, Risk aversion, Avoidance
Introduction
Many disasters generate dread and fear among the directly affected population and often also among those who believe they may be subsequently affected by the current or a similar future event. This “fear factor” is intentional in the case of terrorist attacks, accidental in the case of toxic spills, and intrinsic in the case of pandemics. The fear induces behavior that often exacerbates direct losses from disasters in terms of GDP, employment and other macroeconomic indicators, as well as microeconomic welfare measures. Moreover, fear not only pertains to individuals but also to government actions through its elected officials and employees, potentially leading to especially costly responses to reduce risk.
Examples of such behavioral responses to disasters include:
Fear of airline travel following airline industry attacks
Fear of working, shopping, and investing in sites struck by chemical, biological, radiologic and nuclear weapons
Fear of rioting causing businesses to shut down
Fear of returning to earthquake-stricken buildings over concerns for aftershocks
Fear of impending hurricanes or floods causing government to evacuate residents prematurely
Fear of human disease spread leading to government imposing sweeping business shutdown mandates and stay-at-home orders
Fear of public assembly sites and the workplace during a pandemic
Fear of animal disease spread causing extensive herd slaughtering
Fear used as an excuse to ban all imports of suspected diseased or contaminated products
Fear of continued terrorist activity leading to pre-emptive strikes
Estimates of exaggerated behavioral responses to disasters indicate they can be sizable. For example, Rose et al. (2009) estimated that 85% of the business interruption (BI) losses from the World Trade Center (WTC) attacks of September 11, 2001, were attributable to the almost 2-year reduction in airline travel and related tourism. Giesecke et al. (2012), analyzing a simulated “dirty” bomb attack in the financial district of Los Angeles, found that providing higher pay to employees for their aversion to the workplace, discounts to shoppers for their aversion to retail outlets and restaurants, and higher rates of return to investors for their aversion to the location would lead to impacts 15 times greater than ordinary estimates of GDP losses typically measured on the basis of the shutdown of the district for repair and decontamination. Other studies have found similar large responses from the 10 examples of fear-motivated responses noted above (see, e.g., von Winterfeldt and O'Sullivan 2006; New York Times 2011; Oladosu et al. 2013; Rose et al. 2017b; Gertz et al. 2019; Walmsley et al. 2021b).
A major question is whether these behavioral consequences should be included in benefit–cost analysis (BCA) of projects, products, or policies intended to reduce disaster losses. We know that these effects take place, so one of the main issues is whether they can be isolated and measured in a way that avoids overlaps or double-counting with other effects in particular and are consistent with BCA principles in general (see, e.g., Boardman et al. 2018; Farrow and Rose 2018; Farrow 2020; von Winterfeldt et al. 2020). We need to be able to conceptualize and measure these effects so that they are neither over-counted or under-counted.
There is a tendency in benefit–cost analysis (BCA) to shy away from inclusion of such impacts because they often defy quantification or are considered indirect effects. Not only are these behavioral reactions difficult to measure but also to include in policy analysis frameworks. For example, BCA is a powerful tool to evaluate projects, products and policies to reduce disaster losses, but it can also be confining in terms of what can be included among benefits and costs (U.S. Office of Management and Budget (OMB) 2003; U.S. EPA Science Advisory Board 2017, 2021; Boardman 2018). In effect, diminishing what can be included in measuring economic consequences of disasters, which represents the benefits side of the ledger of disaster risk reduction, can lead to an underestimation of benefits of ways to reduce disaster risk.
The purpose of this paper is to develop an economic framework for analyzing and estimating the behavioral effects of disasters and their consequences for disaster losses. We provide definitions, conceptualizations, classifications, and a formal welfare analysis of this category of economic consequences. The analysis is intended to serve as the basis for the legitimate inclusion of a broad range of behavioral consequences in BCA. Because we are interested in a comprehensive assessment of behavioral effects, we also cover resilience adjustments and extend our initial partial equilibrium analysis to the general equilibrium level.
The following section makes important distinctions in the realm of behavioral consequences and risk aversion. Section III analyzes the relationship between behavioral impacts and risk. Section IV presents a categorization of behavioral consequences of disasters in relation to aspects of supply and demand at both the partial and general equilibrium levels of analysis. Section V explores the implications for BCA in terms of the extent to which behavioral responses are amenable to standard welfare analysis. Section VI concludes with a discussion of assumptions and limitations of the analysis and directions for future research.
Background
We distinguish three major categories of behavioral responses affecting BI losses once the disaster strikes:
Mandatory Avoidance Behavior. This is typically enacted by government decree, as in business closures and general population stay-at-home orders to reduce the spread of COVID-19 during 2020, or evacuation orders in anticipation of a hurricane.
Voluntary Avoidance Behavior. This refers to individuals or groups voluntarily refraining from engaging in economic activities, typically out of fear, as in the major downturn in airline travel following 9/11 or people avoiding crowded areas during the COVID pandemic. In this case, no viable inducements exist to influence people to alter their behavior.
Aversion Behavior. This refers to cases where people are inclined to refrain from various activities but can be induced to alter their behavior by such mechanisms as price discounts to patrons of restaurants in areas recently affected by a chemical/biological/radiological attack or providing salary premiums to workers to return to job sites there, as in the case of the dirty bomb study cited above.1
Two complications enter the picture, however. Behavioral responses, like ordinary responses, are affected by resilience, defined here in the narrower sense as actions that reduce losses once the disaster strikes by utilizing remaining resources as efficiently as possible (Rose 2007).2 Examples include businesses coping with disruptions of critical inputs (materials, infrastructure, labor, capital) by such tactics as conservation, finding substitutes, using inventories, relocating to where inputs are available, etc. (Rose 2017; Dormady et al. 2022). Resilience must be factored in to obtain net consequences of disasters, or otherwise the measurement leads to over-estimation of disaster consequences.
Also, the discussion thus far has referred to direct, or partial equilibrium effects, but indirect, or general equilibrium (price and quantity multiplier) effects, that ripple across sectors and geographic areas need also be taken into account. Implementation of resilience leads to general equilibrium effects in a manner analogous to ordinary disaster consequences and exaggerated behavioral effects.
The aforementioned considerations are well illustrated in the case of the economic consequences of the World Trade Center Attacks of September 11, 2001 (see Rose et al. 2009). Had all of the 1100 businesses and government agencies in the WTC simply folded, the direct GDP loss would have been $54.4 billion (in 2020 dollars). However, over 95% of the tenants relocated relatively quickly, and thus this resilience tactic reduced potential losses by 72%. Moreover, the almost 2-year reduction in airline travel and related tourism due to fear of flying represented more than 85% of the remaining direct losses. General equilibrium effects contributed significantly to the bottom-line impact of $138 billion (in 2020 U.S. dollars) as well.
All of the aforementioned impacts are typically included in what has come to be known as Economic Consequence Analysis (ECA). This is an established term representing applications of economic analysis to estimating the direct and indirect impacts of natural and man-made disasters (Rose 2009, 2015; Dixon et al. 2020; Zhou and Chen 2021). It represents a broader analytical framework than traditional economic impact analysis, which is typically applied to more straightforward activities such as opening a new mine or closing an automobile plant. The broadening incorporates features of behavioral linkages and resilience into the analysis.
We also acknowledge at the outset that it is not always possible to distinguish “warranted” vs. “unwarranted” responses. This may not be important in cases where the focus is only on disaster loss estimation. However, it is very important in relation to policy, where decompositions of impacts are useful in targeting responses. Note that the uses of BCA and much of ECA represent bona fide approaches that lend themselves to decomposition by first identifying several causal factors and performing sequential comparative static analysis. This bottom-up approach is in contrast to top-down macroeconomic or time-series analyses that typically deal with aggregates, which makes it difficult to “unscramble the eggs.”
Behavioral Impacts and Risk
Of course, aspects of behavior are ubiquitous in ordinary economic activity, as well as in disasters. Here we focus on a subset of behavior that manifests itself in an increase in the costs of disasters, typically with regard to their effect on the flow of goods and services (BI) and typically measured in terms of GDP and sales revenue, and sometimes in terms of economic welfare measures (Rose 2004). Most of our focus will be on behavioral reactions stemming from fear brought on by the disaster, over and above ordinary fears or beyond pre-disaster risk aversion. We acknowledge that there are some counterpart behavioral responses that can reduce BI losses, such as acts of heroism and merely putting aside fears to resume normal activity, as was demonstrated, for example, in the aftermath of 9/11, through acts of patriotism to show that terrorists had not dampened the American spirit.
We begin with a taxonomy of general behavioral responses of the following three types:
Standard Behavioral Shifts Due to Changes in Preferences resulting from such factors as changes in tastes or product quality, which do not include elements of risk.
- Standard Behavioral Shifts Due to Changes in Risk but with tempered risk perceptions, of which there are two sub-types:
- Characteristics of products or economic activities becoming riskier due to such perceived existing factors as contamination or impending building collapse.
- Increase in probability of potential harm from disasters (e.g., fear of immediate terrorist attacks following an initial event, earthquake aftershocks, a new tornado warning, or longer-term repetitive flooding).3
Non-Standard Behavioral Shifts Due to Misperceptions of Risk, as when fear enters the picture as a result of extreme shock, intense media attention or rumor (social amplification of risk), or stigma effects.4
Individual Behavior
In the exposition to follow, we focus on the behavioral responses of Categories 2 and 3 because they are the ones most frequently associated with disasters. Some of the behavioral linkages are rational responses, while others are not. We attempt to delineate these two categories conceptually but acknowledge the difficulty of doing so empirically (e.g., distinguishing tempered [rational] risk perceptions from “exaggerated” ones). These behavioral responses typically incur additional costs, often quite large in magnitude.
We offer a brief summary of some subtleties relating to aversion behavior following disasters. The term relates to the widely used concept of risk aversion. One of the first aspects to note is that this concept makes distinctions between three major categories of attitudes toward risk: “risk aversion” in a narrow sense, “risk neutrality,” and “risk seeking.” We can exclude the latter in the case of disasters, except for the few who engage in thrill-seeking as tornado chasers or who want to witness a hurricane first-hand.5 We emphasize that ordinary (pre-disaster) risk aversion is not aberrant behavior; it can in fact be a prudent reaction. The sub-category to which we refer pertains to extreme reactions. In such cases, the affected person might exaggerate the probability of a disaster, for example. However, we are focusing on disasters having actually occurred, so the person affected should be well grounded in terms of this consideration, and, therefore, the major behavioral response relates to reactive behavior affecting economic consequences. Gertz et al. (2019) refer to the aforementioned reactions as “inappropriate aversive behavior.” We focus on cases where fear6 enters the picture and exacerbates risk responses.
In addition to individual overreactions to disaster risk, exacerbation is often caused by a phenomenon known as the "social amplification of risk," where fear feeds on itself through word-of-mouth or media attention (see, e.g., Kasperson et al. 1988; Pidgeon et al. 2003). This has been measured effectively by various techniques (see, e.g., Rosoff et al. 2012; Zhao et al. 2019). Behavioral scenario-based experiments using realistic examples of media coverage by Burns and Slovic (2010) and have been integrated into ECA studies such as those of Giesecke et al. (2012) and Rose et al. (2017b).7
Attitudes toward risk are affected by the disaster itself in nuanced ways according to the type of impact. Shupp et al. (2017a) found that individuals who lost someone close to them in the aftermath of the tornado were in fact bolstered by the experience, which led to a decrease in risk aversion. Ambiguity aversion rose for individuals who suffered property damage, a factor that could affect longer-term reconstruction decisions. Shupp et al. (2017b) also found disaster experience influences behavioral factors such as patience and trust. Beine et al. (2020) found increased risk aversion and impatience following an earthquake, which influenced migration decisions. They noted that these effects were in fact cumulative with regard to aftershocks.
In terms of economic modeling and measurement in the context of disasters, the practice has been to identify a shift in a key behavioral parameter. Examples in relation to aversion are changes in product demand or in product and factor supply. These are typically reflected in changes in price elasticities of demand and supply for the case of aversion, and other types of parametric shifts in the case of avoidance behavior, which is not price-responsive (see Section IV for more details).
Note also that behavioral factors affect recovery from a disaster in terms of its time-path and duration, and thus can have a significant effect on BI as well. For example, behavioral factors affect the willingness of people to return to the location of a disaster rather than to resettle elsewhere, as in the example of the hesitancy of people to return to Fukushima (Nagamatsu et al. 2020). Behavioral factors also affect the pace and form of investment in recovery, e.g., funds for repair and reconstruction may be diverted somewhat to mitigating the future hazard if there is strong fear of its reoccurrence. These dynamic effects, however, are beyond the scope of this paper, and the reader is referred to Xie et al. (2018) for a standard CGE analysis and to Gertz et al. (2019), who develop an “anticipatory” CGE model, which has a relatively greater ability to incorporate them.
Government Behavior
Mandatory restrictions on economic activity during disasters typically have two behavioral elements: government decision-making and compliance by businesses and households. In this paper, we focus on the first and assume compliance is forthcoming. We acknowledge that there are significant examples of non-compliance, but these are relatively minor for business closures, as in the case of COVID-19. However, stay-at-home orders are much more difficult to enforce and non-compliance has probably been significant, though no definitive studies have been performed to date (Dash and Gladwin 2007). In a related area of evacuations in the face of disasters, compliance problems arise as well. There are debates over whether force should be used, and its extent if it is.
Government involvement stems from the principle that one of government’s duties is to protect its citizenry. However, the counterargument is that government mandates in general, and some relating to disasters in particular, infringe upon civil liberties (Fairchild et al. 2006). The debate is strongly influenced by the features of the disaster. In the case of a pandemic, it is considered in the general public interest to close businesses due to contagion effects (actions by one individual entity having a significant effect on others), but in evacuation it is more individual-based, though reference is often made to burdens on first-responders who may have to risk their lives saving those who decide to shelter in place.
Government decisions, of course, are not perfect, and subject to behavioral complications described elsewhere in this paper, because they are based on individual behavior. Government officials have their own perception issues and risk attitudes, as well as political considerations of staying in office, which affect the decision to mandate business or individual behavior. Depending on the circumstances, this can lead to delayed responses on closures (such as the mayor’s decision in the movie Jaws not to close the beach after a shark attack in order to maintain tourist revenues) and to overreactions (such as evacuating people prematurely under conditions of great uncertainty about the path of a hurricane or shutting down more businesses than are needed to minimize the economic impact no matter what the cost).8 Outright political considerations can often come into play as well, as when earlier countries use the threat of a foot-and-mouth disease epidemic to ban imports from other countries, with the prime motivation being to help their domestic industry (Oladosu et al. 2013). More broadly, there is an extensive literature on “government failure” tracing back to research on bureaucracies by Niskanen (1971) and still being clarified and extended generally (Orbach 2013) and in relation to disasters (Straub 2020).9
Overall, government behavior is not limited to its decrees but also applies to its information flows, which then encompasses individual behavior in case of both decrees and voluntary compliance. De Vericourt et al. (2021) employ an information design framework (Kamenica and Gentzkow 2011) to analyze government strategic behavior in this regard in the context of COVID-19 pandemic confinement measures. They concluded that government strategy with regard to exaggerating or downplaying the severity of the situation was dependent on the relative preferences between economic activity versus population health.10
Categorization of Behavioral Effects
In this section, we offer a categorization of behavioral consequences of disasters in terms of basic economic elements at the partial and general equilibrium levels. We continue the distinctions made in previous sections, but present them in an organizing framework, as exhibited in Table 1. Note that the entries in the table represent the vast majority of cases for each of the types of avoidance and aversion responses; in some cases, there are notable exceptions that will be discussed as well.
Table 1.
Categorization of Behavioral Consequences of Disasters
| Behavior Type | Partial Equilibrium | General Equilibrium | Adjustments (Resilience) |
|---|---|---|---|
| Avoidance (Mandatory) | |||
| Quarantine | demand truncation | upstream supply-chain | e-commerce; pent-up demand |
| Business | supply truncation | upstream & downstream | telework; recapture |
| Public Transit | supply truncation | upstream supply-chain | other modes |
| Investment | supply truncation | upstream supply-chain | substitution; pent-up demand |
| Import/Export | demand truncation | upstream supply-chain | supply substitution |
| Evacuation | demand truncation | upstream & downstream | substitution; recapture |
| Avoidance (Voluntary) | |||
| Shopping | demand truncation | upstream supply-chain | e-commerce; pent-up demand |
| Workplace | supply truncation | upstream & downstream | Telework |
| Public Transit | demand truncation | upstream supply-chain | other modes |
| Investment | demand truncation | upstream & downstream | relocation; dynamics |
| Import/Export | demand truncation | upstream supply-chain | supply substitution |
| Aversion | |||
| Shopping | demand shift | upstream supply-chain | e-commerce |
| Workplace | supply shift | upstream & downstream | telework; recapture |
| Public Transit | demand shift | upstream supply-chain | other modes |
| Investment | demand shift | upstream & downstream | relocation; dynamics |
| Import/Export | demand shift | upstream supply-chain | production recapture |
We summarize at the outset a major distinction mentioned in passing above, but one that bears specificity at the outset here:
Avoidance: Outright cessation of an activity, where any market inducements will not change the behavior (not price-sensitive)
Aversion: Inclination to reduce an activity, but where the reduction can be moderated by inducements (price-sensitive)
The first impression of the entries in the table is that they are all very similar. This is primarily because the essence of the responses are related to the most basic elements of economics—supply and demand at both the partial and general equilibrium levels. This characterization is also helpful in linking the analysis to formal BCA measures, which focus on these basic elements as well, as will be done in Section IV.
In the summary below, we also mention some subtle distinctions among the responses and their contexts.11
The simplest responses listed in Table 1 are the cases of Mandatory Avoidance, typically by government decree. In the case of COVID-19, this involve Quarantines, or stay-at-home orders of various sorts for the general population. It could also apply to a contaminated area hit by a chemical/biological/radiological/nuclear (CBRN) attack with respect to the physical area affected and/or population residing there. The counterpart under Voluntary Avoidance (see the second partition of Table 1) is people halting their Shopping at establishments they deem unsafe. Both of these are represented by a truncation of demand at the partial equilibrium level, with the demand function shifting potentially to a vertical line at zero demand (see the following section for more details).
Similarly, there is an analogous depiction on the production side for the Mandatory Closures of businesses, represented by a truncation of supply, and at the extreme going to zero for affected enterprises.12 The counterpart in the Voluntary Avoidance partition would be employees staying away from the workplaces they consider unsafe, which would represent a full truncation of supply if complete, or a partial truncation if not, but in this case in terms of the supply of labor (factor market) rather than supply of goods and services (product market). Note also that Mandatory closures dominate Voluntary ones, in that it does not matter whether workers are inclined to stay away from their place of employment if those businesses are closed.
Focusing further on the partial equilibrium level, Public Transit is basically the same in both cases, though the truncation is likely greater in the Mandatory case because it does not allow for any leeway on the part of the customer. For Voluntary Avoidance, in this case and for other responses, the truncations may not be as great because there may be some threshold of risk below which people may engage in an activity, as in the willingness to risk some level of contamination or to place oneself in harm’s way in general.
As to Investment, government may decree that certain geographic areas are off-limits for future rebuilding, as in a toxic waste spill (or buildup), CBRN release, or forbidding building in floodplains. This may be either temporary or permanent. Nevertheless, it essentially restricts the supply of investment opportunities. On the other hand, voluntary investment avoidance is a demand-side phenomenon and may be partial because some investors are scared off and others are not.
As to Mandatory Avoidance of imports and exports, this arises in the example of banning the sale of meat products following the confirmation of an animal disease. These are characterized as demand truncations in the importing country banning the sale but a demand shift to the exporting country when this is not the ubiquitous response in foreign markets; likewise, it is a supply truncation if it applies to all domestic beef sales but a supply shift otherwise. This is another case where one aspect of the supply–demand scissors trumps the other.
Evacuation is actually very similar to Quarantine in terms of placing a geographic area off-limits. The subtle difference is that it involves a geographic movement out of the area, which allows people to likely engage in more economic activity than in the Quarantine case, though elsewhere.
A major distinction appears in the third partition of Table 1 with respect to demand and supply. As emphasized above, Aversion Behavior is not absolute, but is price-sensitive. Hence, supply and demand are not likely to be truncated as in the previous two categories. However, in the cases of supply and demand shifts associated with Aversion, they also would not likely result in completely vertical supply and demand curves, but rather more standard, and possibly just parallel, shifts downward of either or both curves.13 Otherwise, each of the response types in the Partial Equilibrium column are basically the same between Aversion and Voluntary Avoidance in terms of being demand- or supply-related.
General Equilibrium responses are best thought of in terms of supply-chain reactions in markets related indirectly to the partial equilibrium responses. The major distinction here is whether the supply-chain effect is upstream or downstream or both. In the context of business operations, both upstream (relating to the demand for inputs) and downstream (relating to the supply of outputs) effects are operative, except for consumer goods, investment goods and exported goods, which have no supply-side linkages because they don’t stimulate, positively or negatively, any further production in the geographic area in which the impacts are being measured.14 In the table, we specify the relationship according to the majority of likely cases. For example, Public Transit is characterized as a consumer good, though we know that some aspects relate to business activity. Evacuation falls primarily on the affected population, but, as an economic effect, is not limited to consumption but also refers to business closures.
The column labeled “Adjustments” pertains primarily to Partial Equilibrium responses in terms of additional ramifications. Some of them could in fact be part of the general equilibrium responses as well, however. For example, telework is a way of contributing to economic production activity even when people shy away from the workplace. It represents a tactic of economic resilience – a strategy intended to utilize available resources as efficiently as possible to maintain function (Rose 2007).15 Rose (2009) has related resilience to the economic production function for such responses, primarily to the disruption of inputs, in terms of standard economic adjustments such as input substitution (e.g., goods and location), productivity changes (e.g., conservation and technological change), excess capacity and inventories. These resilience tactics have been successfully estimated empirically for both hypothetical events (see, e.g., Kajitani and Tatano 2009; Wei et al. 2020) and actual events (see, e.g., Rose 2009; Dormady et al. 2022) in both partial and general equilibrium contexts.
In addition to the telecommuting resilience example, others include consumers resorting to e-commerce or shifting their purchases over time in terms of pent-up demand (Walmsley et al. 2021a). In the case of Public Transportation, this involve shifts to other transportation modes (Rose 2009; Rose et al. 2017b).16 In terms of investment, this refers to relocation and also has a dynamic element if the investment is delayed. In terms of evacuation, it involves the shift (substitution) of spending to other locations.
Production recapture is a unique resilience tactic, and the only one that refers to the output, rather than input, side of the production function. It relates to the ability to make up for lost production by working overtime or extra shifts once productive capacity is restored (Park et al. 2011). Various studies have indicated it has sizable potential – as high as 90% + in manufacturing and mining industries and much lower, but still significant, amounts in utilities, services and agriculture (Wei et al. 2020; Dormady et al. 2022). Note also that production recapture is the supply-side counterpart of the demand-side pent-up demand.
Overall, resilience adjustments are such as to typically reduce the negative impact of behavioral responses on economic consequences. There is every reason to venture, moreover, that their offsetting effects are as powerful for behavioral responses as they are for the same level of consequences caused by other types of disaster shocks.17
Economic Welfare Analysis
In this section, we present an economic welfare analysis of avoidance and aversion behavior. The intent is to demonstrate that behavioral responses to disasters, even exaggerated ones, are amenable to such analyses, and hence can legitimately be included in BCA.
The workings of the three types of behavioral shifts presented in Section III as an underpinning for these phenomena could be analyzed using standard consumer theory (or production theory for the case of businesses) and expected utility theory. However, we skip this step and proceed to the more straightforward result of these behavioral shifts in terms of changes in supply and demand, since these are more operational aspects of the analysis in terms of actual measurement of behavioral linkages.18
We illustrate examples of Mandatory Avoidance, Voluntary Avoidance, and Aversion Behavior in the figures below in terms of standard analysis of Welfare Maximization. Figures 2, 3, and 4 depict the change in consumer surplus and producer surplus, the combination of which represents the change in total economic welfare due to behavioral responses. In Fig. 4, this is dichotomized into cases of a shift in the demand curve and a movement along a truncated version of it.
Fig. 2.
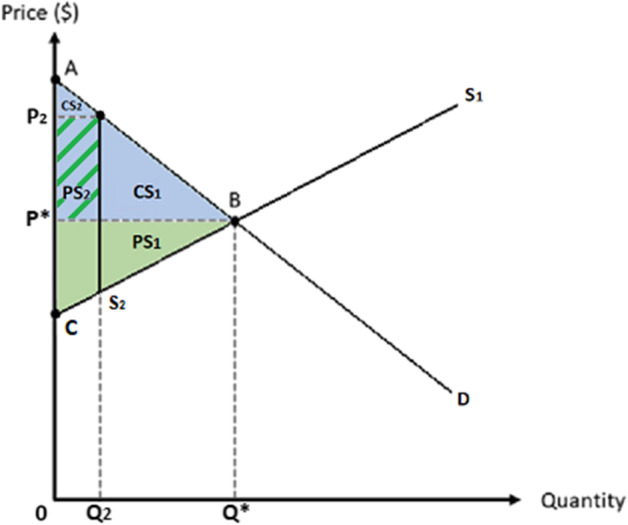
Partial Equilibrium Welfare Effects of Mandatory Closures
Fig. 3.
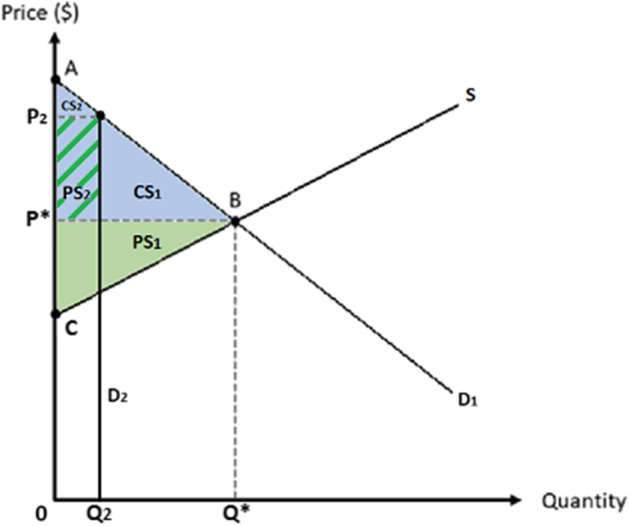
Partial Equilibrium Welfare Effects of Avoidance Behavior
Fig. 4.
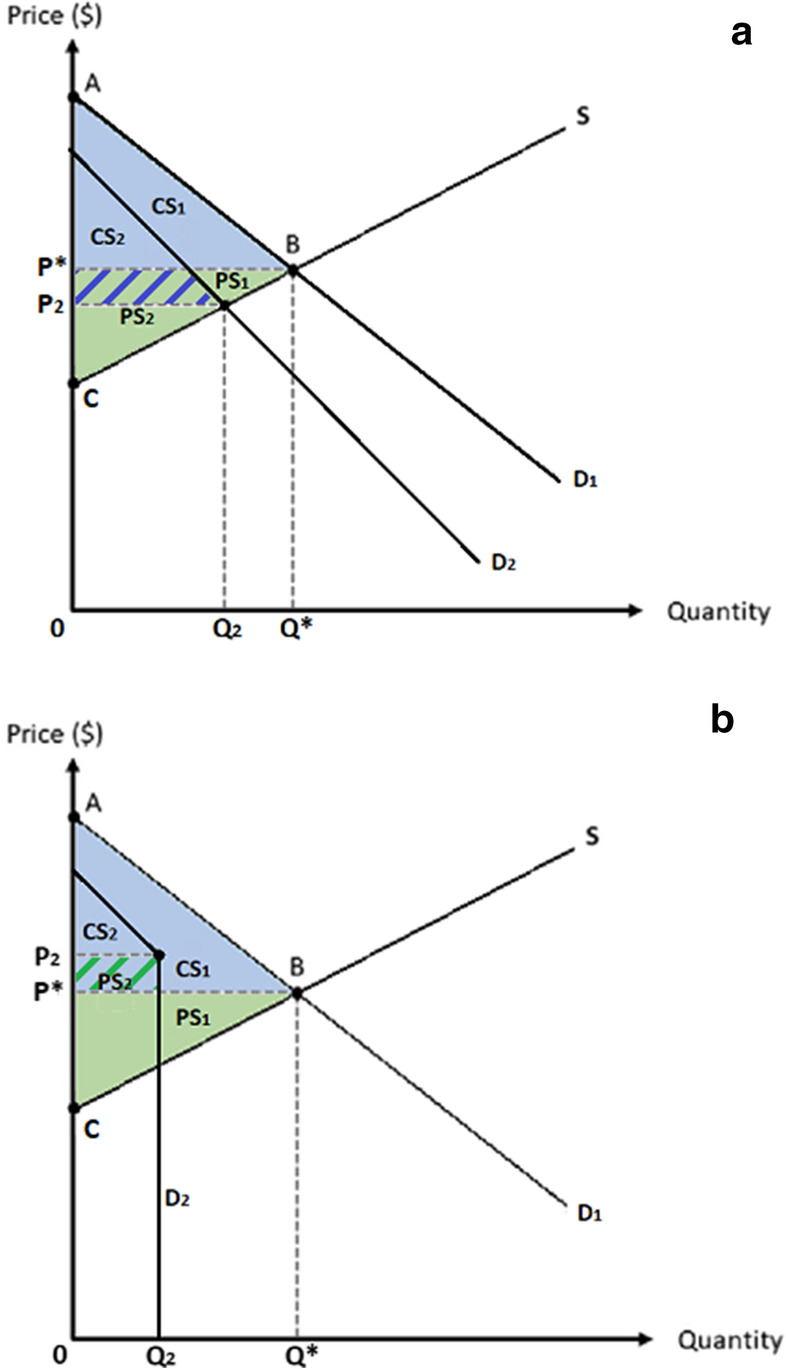
a Partial Equilibrium Welfare Effects of Aversion Behavior (Demand Shift). b Partial Equilibrium Welfare Effects of Aversion Behavior (Truncated Demand).
Figure 1 is the standard market welfare analysis diagram. The market is in equilibrium at the intersection of Demand (D) and Supply (S), with the equilibrium quantity demanded (Q*) and equilibrium price (P*) determined simultaneously. This equilibrium is also an optimal allocation of resources since it maximizes the sum of consumer surplus (CS) and producer surplus (PS).
Fig. 1.
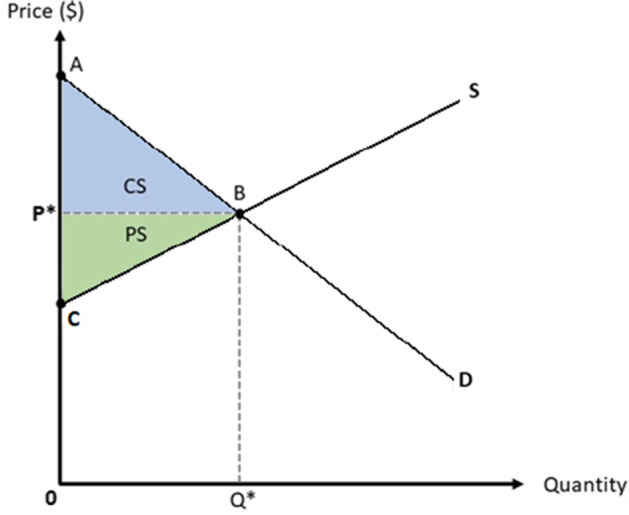
Pre-Disaster Partial Equilibrium Welfare Maximization
The case of Mandatory Closures, as in response to the COVID-19 pandemic, is very simple if the closures are complete. In that case, a truncated supply curve would be a vertical line at the zero axis, effectively indicating that no supply of the good or service is forthcoming. The welfare loss would be the entirety of the CS + PS. To illustrate the situation more generally, however, we refer the reader to Fig. 2, which depicts the case where some supply is forthcoming even under mandatory closures, which could arise, for example, in the financial service industry, where telework is an extensive option. In this case, the new supply curve is upward sloping (moving along the lower portion of S1) to the output level limit (Q2) but then becomes perfectly vertical (S2). (Of course, the marginal cost could also have increased, in which case the upward sloping portion of the supply curve would be higher than before until it goes vertical, but that does not significantly affect the analysis.)19 The new equilibrium is the point at which S2 intersects the demand curve, D.20 The shortage results in an increase in price from P* to P2 if prices are allowed to rise.21 The welfare loss is that part of Consumer Surplus to the right of S2 plus that part of producer surplus to the right of S2. One interesting outcome is that the remaining consumer surplus (CS2) is now very small because of the price increase, and the new producer surplus (PS1 + PS2) is now proportionally larger than its consumer counterpart, as depicted by the crosshatched blue/green area to the left of S2 and bounded by P*and P2 (just the opposite of the original pre-closure equilibrium in our example). This also means, of course, that consumers have lost much more welfare than have producers, and that producers have captured some of the former consumer surplus. If the demand curve were very steep, however, this proportionality outcome would be reversed. However, it is unlikely that this market would be characterized by a very inelastic demand because that would be more consistent with the good or service being a necessity or “essential,” and hence less likely to be subject to mandatory closures in the first place.
The case of Voluntary Avoidance would be identical to that of Mandatory Closures as exhibited, if the avoidance were complete, which would involve the total elimination of both consumer surplus and producer surplus as in the case of the total truncation in supply under the initial Mandatory Closures case.22 Again, however, we examine a more interesting case where avoidance is partial in Fig. 3. In this case, the supply curve remains fixed, but the demand is limited, such that it truncates at the level of output Q2 and is depicted as the vertical demand, D2, after that point, with the new equilibrium again being at price P2. This assumes that the high demanders do not change their demand, but it suddenly drops at Q2. (Alternatively, the entire demand function could shift downward so that only a small quantity is demanded, where the intersection might be a little above point C, and price would fall dramatically.)23 Ironically, however, for the truncated case, the outcome is the same as in the Mandatory Closures case as depicted in Fig 2. Moreover, we can offer a similar insight regarding the elasticity of demand for cases other than strong necessities, which would represent a meaningful subset here. The difference is that the demand truncation is not likely to be as extreme for these goods; hence the producer and consumer surplus losses would not be as great. Moreover, there is the possibility that the more inelastic demand curve would result in the remaining consumer surplus exceeding that of the remaining producer surplus. Note that the demand change at output level Q2 in this case is at the same level as in the Mandatory Closure case. Q2 for the case of Voluntary Avoidance is likely to be at a higher level of output, however, because the closures in this case should allow for some responses that are not dominated by fear.
We split the case of Aversion Behavior into two parts. The first is depicted in Fig. 4A, which exhibits a downward shift in demand for the good (D2). For example, consumers are less likely to demand restaurant services at a given price in the aftermath of a dirty bomb attack or during and after a pandemic (in contrast to the avoidance cases, which are not price-sensitive). If the demand shift were parallel, then the reduction in consumer surplus and producer surplus would be proportional between the two groups), with the amounts determined by the new equilibrium intersection of demand and supply. However, we have drawn the new demand curve as relatively steeper to depict the hesitancy of consumers to partake of the good or service under dangerous conditions. In this case the remaining consumer surplus proportion is relatively larger than that of its counterpart producer surplus because of the price decrease.
We also consider the case where there is no shift in the demand curve for the good or service in question, but rather a limit in the quantity demanded. This could arise if there is some threshold level of contamination or exposure that can be tolerated. This results in a truncated demand curve similar to that depicted for the Voluntary Avoidance case (recall Fig. 3). We have drawn the limit at a higher level of output, however, than in the Voluntary Avoidance case, because this case is price-sensitive, thereby allowing for more latitude. In this case the new price would be at P2, though this does not convey the typical equilibrium properties of a demand and supply curve analysis; there is no reason the producers would lower the price to the intersection of D2 and S, if the marginal consumer is willing to pay P2. The outcome is similar to that in Fig. 3, in that the remaining producer surplus is larger than the remaining consumer surplus. However, we acknowledge that the aforementioned is only one of three possible interpretations. At the other extreme is the possibility that suppliers would bid down the price of the product because of an implied excess supply at P2 (though the fact that the supply is beyond the limit of demand makes this less plausible). In the extreme version of this case, the price would drop to the intersection of D2 and S, where the total reduced surplus is the same as in the first interpretation, but with consumers capturing the lion’s share. The third possibility is analogous to the outcome of oligopoly pricing. In effect, the demand curve drops from the point of its aversion limit to a horizontal zero level thereafter, thereby becoming a “kinked” demand curve overall, with the outcome being indeterminate somewhere along the vertical gap. But, again, total surplus is the same as in the other two cases; it’s just the distribution that differs.
Some general results are apparent from a comparison of these figures. First, behavioral responses are likely to result in greater losses of surpluses in the case of Mandatory Closures than in the other two cases, because of the more dramatic truncations in the former, ceteris paribus. In contrast to the other cases, Aversion Behavior is more likely to have two effects: a downward shift in the demand curve, and then a movement along it but only up to a limit and then an ambiguous equilibrium. Note also that we have simplified the analysis for sake of exposition, as the same event could trigger voluntary Avoidance behavior to some of those affected and Aversion behavior to others (see, e.g., Giesecke et al. 2012).
Note that since the direct behavioral reactions enumerated in the previous section can be interpreted in terms of demand and supply functions, they are also consistent with the basic conceptual approach of BCA. They are in fact amenable to estimation of standard economic welfare measures (metrics), in terms of approximations of consumer and producer surplus compensating variation and equivalent variation. This augurs well for their inclusion in BCA. In ECA, their inclusion is not dependent on welfare analysis; however, supply and demand shifts can simply be evaluated in terms of their impacts on GDP or income indicators that are deemed appropriate for ECA but not necessarily consistent with welfare measures.
Moreover, the general equilibrium (indirect, or supply-chain) effects of behavioral responses can also be measured in the standard manner as performed in non-disaster contexts, though there may be limits as to the extent that they can be legitimately included in BCA (U.S. EPA Science Advisory Board 2017; Farrow and Rose 2018). We know at the outset of this section that the legitimacy of this inclusion is often broader than intimated in standard benefit–cost analysis texts. For example, Boardman et al. (2018) advise against the inclusion of indirect effects because they do not account for the siphoning off of resources from existing activities. Only later in the exposition, and appearing as an afterthought, is it mentioned that this applies only to the case of full employment. We emphasize the asymmetry, however, of positive and negative economic impacts in the context of disasters. Most standard BCA texts focus on project evaluation or policy analysis, typically with expansionary ramifications, where the existence of full employment or the possibility that the project or policy will exceed the available labor (or capital) supply are serious concerns. Disasters are just the opposite, where the impacts of a negative effect of a decline in economic activity doesn’t usually run up against a labor supply ceiling, unless there are an extensive number of deaths/injuries or when Mandatory Avoidance is invoked. Thus, the standard caveat does not usually apply.
Direct estimation methods can be used to measure the reduction in demand and supply associated with behavioral responses to disasters. These methods include using actual data, adjusted for background conditions such as detrending for the on-going recession estimating the decline in airline travel in 2001 (e.g., Rose et al. 2009), or the use of survey methods to measure avoidance of mass gathering locations during COVID (e.g., Byrd and John 2021; Walmsley et al. 2021a), or experimental methods to measure the price inducements pertaining to aversion behavior (e.g., Giesecke et al. 2012).24
Standard applied general equilibrium models can be used to measure the indirect effects of the behavioral responses, as in the aforementioned studies. The more difficult estimation pertains to resilience adjustments, typically in terms of spending on substitutes. This involves bringing in another market and having knowledge of substitution possibilities, but this is not a heavy lift using data transfer methods. The recent COVID pandemic relates to a variation on this theme—people do not necessarily substitute other goods for those not available during the mandatory business closures, but simply defer spending to a later date, i.e., pent-up demand (Walmsley et al. 2021a, 2021b).
In concluding this section, we note an important aspect of a broader analysis of avoidance and aversion behavior. These behavioral responses may lead to large welfare changes from non-market effects, such as lives saved, that should be evaluated, though separately (Rose 2021a, b).
Conclusion
This paper has intended to provide a formal foundation for the analysis and empirical measurement of behavioral economic consequences of disasters for inclusion in benefit–cost analysis. The major step toward their legitimate inclusion is the demonstration that various behavioral responses can be translated into straightforward demand and supply reactions.
The reader is reminded of the importance of behavioral considerations in the overall estimation of economic consequences of natural disasters, technological accidents and man-made disasters such as terrorism. Studies have shown that behavioral effects can be one or two orders of magnitude larger than the standard economic impacts typically calculated. At the same time, we have cited studies that indicate resilience strategies to prevent some business interruption caused by behavioral linkages can have a significant partially offsetting effect and hence should be included in the calculation, for which the net effect can still remain very large.
Exaggerated behavioral responses are rarely factored into BCA of disasters, especially in the cases of voluntary avoidance and voluntary aversion. There are several reasons for this situation. First, the analysis of aversion behavior is rare outside the area of toxic wastes or other forms of extreme contamination. Second, many behavioral responses illustrated in this paper, such as “fear of flying,” relate to “off-site” responses to a disaster, and are therefore often mistakenly tabbed as “indirect.” Inclusion then runs up against the many strictures in opposition to embracing indirect effects in BCA. However, this is in part due to a misunderstanding of the meaning of “indirect” effects, where the tradition has often been to consider property damage the only direct effect, and even the associated business interruption as indirect. Behavioral effects illustrated in this paper are just as direct a set of responses to the disaster as is property damage or BI. The “indirect” aspects would be the conventional multiplier or general equilibrium associated impacts. Various forms of macro-level analysis are able to subsume direct and indirect behavioral responses, but not to be able to isolate them from other causal factors. A bottom-approach, exemplified by the CGE analysis of Nassios and Giesecke (2018) has demonstrated the worthiness of this latter approach, in part by showing the results are consistent with those derived from the econometric timeseries modeling, such as that undertaken by Blomberg and Hess (2009).
Note that we have not always explicitly distinguished ordinary behavior and behavior unique to disasters in the course of this paper. In some cases, this is not an important distinction, as many methodological approaches would simply utilize a shift in demand and supply, where the shifts might represent the totality of behavioral responses. Normal responses are likely to be built into most models, e.g., in terms of ordinary substitutions among inputs by producers or goods/services by households or in absolute changes in economic activity in either one, as in reaction to a government mandate banning importation of contaminated products or to mandate business closures. If the behavioral needs of the modeling are focused on exaggerated behavior, then we have shown that the behavioral shift can also be incorporated as parametric changes reflecting limits on activity or shifts in supply and demand. This can serve as the basis for separating the consequences of non-ordinary behavioral responses from the ordinary ones.
Of course, the difference between ordinary behavior and exaggerated behavior is more important in the case of policy analysis, since the remedies to steer these two kinds of behavior in a positive direction are likely to differ significantly. In that context, it would be desirable to decompose these two sets of responses to gauge their relative influence and formulate policies according to priorities and potentials.
There are likely many projects, products and policies worthy of assessment that have the ability to dampen negative behavioral responses that exacerbate losses from disasters, especially when the countermeasures would appear to be so relatively inexpensive. Examples include the verified influence of risk messaging to alter behavior about fear of airline travel or information campaigns and financial inducements to increase vaccination “take-up” rates. In addition, more expensive options that assure thorough decontamination of toxic spill sites or the dispatch of security personnel to keep the peace are also likely to pass the benefit–cost test in most instances.
We also acknowledge that we invoked a number of simplifying assumptions into our formal analysis. First, we have characterized behavioral responses effectively as “games against nature” or a non-adaptive adversary, in general, rather than explicitly analyzing strategic behavior with an adaptive adversary, including business-consumer interactions or either of these sets of entities in relation to government decisions. We’ve also not examined considerations of market power, nor have we analyzed the issue in the context of uncertainty. Finally, we have not addressed any equity issues associated with behavioral responses, where there is an increasing call for the inclusion of this criterion in general into BCA. Loosening of these assumptions presents several areas of future research. However, the most important, and likely most challenging, will be the empirical measurement of behavioral responses, especially the distinction between ordinary and exaggerated ones.
Data Repository
No data sets are used in this manuscript.
Footnotes
Note that our focus is on behavioral reactions that typically exacerbate losses once the disaster strikes. There is another use of the term “avoidance” in the literature referring to protective or preventative behavior in advance of a disaster typically referring to interdiction and mitigation, which reduce the frequency or magnitude of disasters (see, e.g., Boardman et al. 2018), but this is a far different area of inquiry and beyond the scope of this paper.
We prefer to use flow measures of welfare, since it is the flows of goods and services from assets (stocks) that contribute to economic well-being. It is not possible to reduce property damage once the disaster strikes (except for ancillary impacts, such as fires or toxic spills), but it is possible to reduce losses in GDP or sales revenue (often referred to the literature as business interruption). We invoke this narrow definition of resilience to reflect the "bounce-back" meaning of the Latin root of the term and it being synonymous with business continuity (Rose 2004, 2007; Berke and Campanella 2006; Cutter 2016). This is in contrast to the broader definition of resilience, typically preferred by engineers (see, e.g., Bruneau et al. 2003) that also includes pre-disaster risk reduction, or mitigation. At the same time, we acknowledge that resilience is a process, and its capacity can be enhanced in advance by pre-positioning assets (e.g., purchasing portable electricity generators, increasing stockpiles of critical materials, lining up alternative sources in the supply chain and engaging in emergency management drills), but the implementation of all of these resilience tactics does not occur until the disaster strikes.
We do not delve further into measuring tempered risk perceptions versus exaggerated ones, except for the following observations: The price-responsiveness of Aversion Behavior provides a handle by which to measure the direct cost of behavioral changes. The results could be compared with science-based estimates of the probability and consequences of additional harm to distinguish Category 2 and Category 3.
These are a subset of a general category of respsonses referred to as “bounded rationality” (see, e.g., Gigirenzer and Selten (2001).
Risk attitude is typically defined in microeconomics and decision analysis in terms of the shape of the utility function: concave is risk averse, linear is risk neutral, and convex is risk seeking. It specifies a transformation on an outcome scale that reflects preferences for gambles, assuming rational (maximization of expected utility) preferences. Risk attitude is operationalized as a parameter defining the concavity of the function, e.g., risk tolerance. Note that emotional, behavioral, and cognitive responses to disasters can differ significantly across individual, socioeconomic, political orientation and locational characteristics (McArdle et al. 2012).
We omit consideration of "dread," which is often referred to as a feeling of great fear, and usually in an anticipatory fashion. Moreover, dread has more of a passive connotation in terms of internal feelings, while fear typically refers to an actionable emotion. The exaggerated actions of disaster victims are the focus of this paper.
Note that psychologists make the distinction between cognitive and affective (emotional) determinants of risk perception and avoidance behavior. Risk attitude is generally a cognitive component, while the aversion behavior discussed here is an affective, or emotional, component. Slovic (1987) and others have posited the affect heuristic, in which risk perception is based on emotions, such as fear or anger, rather than rational components, such as probability and magnitude of loss. This is sometimes referred to as “risk (perception) as feelings.”
The cost of evacuation is lower than often specified (including the costs of housing and feeding the displaced population), and, in terms of economic consequences (Whitehead 2003). One aspect of resilience that is typically omitted in evacuation studies is the “recapture factor” (Rose 2009a, b; Park et al. 2011), which refers to the potential to make up lost production in many sectors by working overtime or extra shifts once the population returns.
Another critical factor is that managing disasters requires certain critical competencies and institutional capacities, which, when sorely lacking, as in the case of Hurricane Katrina, can greatly exacerbate disaster losses (Waugh 2006; Kapucu and van Wart 2008). This consideration, added to the behavioral considerations discussed earlier, often leads to an exacerbation of disaster losses. As noted at several junctures in this paper, it is not our intent to provide a definitive way to conceptually or empirically sort out all of these factors. Moreover, for estimating bottom-line measures of economic consequences it is not necessary to do so. Analytically, it helps to identify all causal factors, but often they reveal themselves after the fact, as in the case of the decline in airline travel and related tourism in the aftermath of 9/11 or the various types of losses following Hurricane Katrina. Alternatively, scenario or sensitivity analyses can be applied to cover the range of uncertainties about the relative influence of causal factors (Rose et al. 2017a).
This is an interesting instance of influencing fear and quelling it (the latter ironically being done in an “exaggerated” way). This line of inquiry proceeds further down an interesting path by concluding, consistent with long-standing findings, that socioeconomic status influences individual responses to threats.
We have made the distinction between avoidance and aversion solely on the basis of price sensitivity. This is not the only factor that can warrant distinctions. For example, avoidance can be reduced by “nudges” (Sunstein and Thaler 2008) or risk communication, both of which are low-cost and effective up to a point.
We do not go into details about how one translates information on behavioral responses into supply or demand changes. The reader is referred to Giesecke et al. (2012) for a detailed account. Note also that this approach has been formally validated by Nassios and Giesecke (2018) in comparing their methodology to a macroeconometric analysis of the economic consequences of the September 11 World Trade Center attacks by Blomberg and Hess (2009).
Giesecke et al. (2012) model these as vertical shifts in the demand curve, for example, because they relate to price, rather than the more typical horizontal demand shifts relating to non-price aspects (shifters) of demand functions, such as income, population, or regulations.
Investment does stimulate additional production, but in future time periods, rather than the one under study in a static modeling formulation.
Rose (2009a, b) makes the distinction between static and dynamic economic resilience, where the latter refers to investment in repair and reconstruction to promote recovery. Resilience tactics differ somewhat in this case, in that they are geared primarily to actions that facilitate investment, such as increasing outside assistance, cutting red tape, etc. (see Xie et al. 2018).
In both of these studies, and some others noted in this section, avoidance and/or aversion behavior, as well as resilience, were included. For example, in the 9/11 study, avoidance was simulated by an estimate of the decline in airline travel, but the workings of the computable general equilibrium model then included aspects of the transportation mode shift as a partially offsetting increase in overall transportation demand.
Another major example of reducing losses from disasters, especially pertinent to behavioral impacts, and basically parallel to the examples of resilience presented above, pertains to the area of risk communication (see, e.g., Rosoff et al. 2012). This has the ability to quell fears after the disaster, and even to anticipate fears through inoculation messaging prior to disasters (Ivanov et al. 2018). But see also Fischhoff et al. (2003) on perception problems people have in processing such communications.
Demand curves, for example, can be derived from a set of indifference curves in utility space, but such a derivation is not necessary for the exposition presented here. Also, change in welfare is typically measured by equivalent variation or compensating variation and can be exhibited in utility space as well, but not as transparently as the supply/demand exposition below.
Firms do have the ability to affect their supply during mandatory closures in some instances, as for example, restaurants providing take-out food instead of in-room dining.
We are performing the analysis under ceteris paribus conditions, so we assume that the demand curve is unchanged, but such a change can readily be incorporated within the simple analytical structure of the presentation without loss of generality.
There are often strictures against businesses raising prices in the aftermath of a disaster, because price increases are often viewed as gouging. However, some aspects of price increases are warranted by cost increases associated with increasing resource scarcity or increases in demand.
The truncation of demand in this market may shift activity to another market, partially offsetting the welfare loss. The offset would be only partial, since the original equilibrium was deemed to be a unique optimum, and the adjusted equilibrium, including substitutions in a related market, would thereby have to result in some overall loss in economic welfare because it is a departure from the pre-disaster resource allocation.
The demand shift would more explicitly represent some fearful consumers leaving the market.
An alternative approach to calculating behavioral losses is to use the value of defensive measures, with the implication that rational actors would not spend more than the value of losses prevented (Boardman et al. 2018; Phaneuf and Requate 2017). However, this approach finesses the complexities of behavior losses this paper intends to elucidate, so we only note it in passing. Another reason for not favoring the proxy approach pertains to the likelihood that the defensive expenditures would be only a lower bound and might in fact greatly underestimate losses due to behavioral responses given the magnitude of many of these responses vs. the very low cost of defensive measures, as in the case of wearing facemasks or getting vaccinated to prevent infection from COVID-19. Additional limitations of the defense expenditure approach are provided by Boardman et al., (2018).
The author is Senior Research Fellow, Center for Risk and Economic Analysis of Threats and Emergencies (CREATE), and Research Professor in the Price School of Public Policy, University of Southern California. I wish to acknowledge the helpful comments of Scott Farrow, Detlof von Winterfeldt, Richard John, Vicki Bier, Dan Wei, Chris Zobel, Gilberto Montibeller, and 2 anonymous reviewers. I also appreciate the helpful research assistance of Konstantinos Papaefthymiou. This research was supported by the Directorate of Science and Technology of the United States Department of Homeland Security through the National Center for Risk and Economic Analysis of Threats and Emergencies (CREATE) under Task Order 70RSAT20FR0000046. However, any opinions, findings, conclusions or recommendations in this document are those of the author and do not necessarily reflect views of the United States Department of Homeland Security or the University of Southern California.
Publisher's Note
Springer Nature remains neutral with regard to jurisdictional claims in published maps and institutional affiliations.
References
- Beine M, Charness G, Dupuy A, Joxhe M (2020) Shaking things up: on the stability of risk and time preferences. CESifo Working Paper No. 8187. https://www.econstor.eu/bitstream/10419/216583/1/cesifo1_wp8187.pdf. Accessed 10 Aug 2021
- Berke P, Campanella T. Longer view: urban resilience and the fate of New Orleans. J Am Plann Assoc. 2006;72(2):1–6. [Google Scholar]
- Blomberg S, Hess G (2009) Estimating the macroeconomic consequence of 9/11. Peace Econ Peace Sci Public Policy 15(2). 10.2202/1554-8597.1167
- Boardman A, Greenberg D, Vining A, Weimer D (2018) Cost-benefit analysis: concepts and practice (5th ed). Cambridge University Press, Cambridge. 10.1017/9781108235594
- Bruneau M, Chang S, Eguchi R, Lee G, O’Rourke T, Reinhorn A, et al. A framework to quantitatively assess and enhance seismic resilience of communities. Earthq Spectra. 2003;19:733–752. doi: 10.1193/1.1623497. [DOI] [Google Scholar]
- Burns W, Slovic P (2010) Predicting and modeling public response to a terrorist strike. In: Slovic P (ed) The feeling of risk: new perspectives on risk perception. Routledge, London
- Byrd K, John R (2021) A survey of avoidance behavior during COVID-19. Center for Risk and Economic Analysis of Threats and Emergencies (CREATE), University of Southern California. Los Angeles, CA
- Cutter S. The landscape of disaster resilience indicators in the USA. Nat Hazards. 2016;80:741–58. doi: 10.1007/s11069-015-1993-2. [DOI] [Google Scholar]
- Dash N, Gladwin H. Evacuation decision making and behavioral responses: individual and household. Nat Hazard Rev. 2007;8(3):69–77. doi: 10.1061/(ASCE)1527-6988(2007)8:3(69). [DOI] [Google Scholar]
- de Vericourt F, Gurkan H, Wang S (2021) Informing the public about a pandemic. Manage Sci. 10.1287/mnsc.2021.4016
- Dixon P, Rimmer M, Giesecke J, King C, Waschik R (2020) The effects of COVID-19 on the U.S. macro economy, industries, regions and national critical functions. Report to the U. S. Department of Homeland Security Centre of Policy Studies, Victoria University, Melbourne, Australia
- Dormady N, Rose A, Roa-Henriquez A, Morin B. The cost-effectiveness of economic resilience. Int J Prod Econ. 2022;244:108371. doi: 10.1016/j.ijpe.2021.108371. [DOI] [Google Scholar]
- Fairchild AL, Colgrove J, Jones MM. The challenge of mandatory evacuation: providing for and deciding for. Health Aff. 2006;25(4):958–967. doi: 10.1377/hlthaff.25.4.958. [DOI] [PubMed] [Google Scholar]
- Farrow S. Frequently asked questions in the use of benefit-cost analysis for evaluating homeland security projects. Center for Risk and Economic Analysis of Terrorism Events (CREATE) Los Angeles, CA: University of Southern California; 2020. [Google Scholar]
- Farrow S, Rose A. Welfare analysis: bridging the partial and general equilibrium divide for policy analysis. J Benefit-Cost Anal. 2018;9(1):67–83. doi: 10.1017/bca.2017.29. [DOI] [Google Scholar]
- Fischhoff B, Gonzalez R, Small D, Lerner J. Evaluating the success of terror risk communications. Biosecur Bioterror. 2003;1(4):1–4. doi: 10.1089/153871303771861450. [DOI] [PubMed] [Google Scholar]
- Gertz A, Davies J, Black S. A CGE framework for modeling the economics of flooding and recovery in a major urban area. Risk Anal. 2019;39(6):1314–1341. doi: 10.1111/risa.13285. [DOI] [PubMed] [Google Scholar]
- Giesecke J, Burns W, Barrett A, Bayrak E, Rose A, Slovic P, Suher M. Assessment of the Regional Economic Impacts of Catastrophic Events: A CGE Analysis of Resource Loss and Behavioral Effects of a Radiological Dispersion Device Attack Scenario. Risk Anal. 2012;32(4):583–600. doi: 10.1111/j.1539-6924.2010.01567.x. [DOI] [PubMed] [Google Scholar]
- Gigirenzer G, Selten R, editors. Bounded Rationality. Cambridge, MA: MIT Press; 2001. [Google Scholar]
- Ivanov B, Sellnow T, Getchell M, Burns W. The potential for inoculation messages and post inoculation talk to minimize the social impact of politically motivated acts of violence. J Contingencies Crisis Manag. 2018;26(4):414–424. doi: 10.1111/1468-5973.12213. [DOI] [Google Scholar]
- Kajitani Y, Tatano H. Estimation of Lifeline Resilience Factors based on Empirical Surveys of Japanese Industries. Earthq Spectra. 2009;25(4):755–776. doi: 10.1193/1.3240354. [DOI] [Google Scholar]
- Kamenica E, Gentzkow M (2011) Bayesian persuasion. Am Econ Rev 101(6):2590–2615. 10.1257/aer.101.6.2590
- Kapucu N, Van Wart M. Making matters worse: an anatomy of leadership failures in managing catastrophic events. Adm Soc. 2008;40(7):711–740. doi: 10.1177/0095399708323143. [DOI] [Google Scholar]
- Kasperson R, Renn O, Slovic P, Brown H, Emel J, Goble R, Kasperson J, Ratick S. The Social Amplification of Risk: A Conceptual Framework. Risk Anal. 1988;8:177–187. doi: 10.1111/j.1539-6924.1988.tb01168.x. [DOI] [Google Scholar]
- McArdle S, Rosoff H, John R. Identifying Moderators of Changing Worries, Concerns, and Behavioral Avoidance Following 9/11. Risk Anal. 2012;32(4):744–761. doi: 10.1111/j.1539-6924.2012.01814.x. [DOI] [PubMed] [Google Scholar]
- Nagamatsu S, Rose A, Eyer J. Return Migration and Decontamination after the 2011 Fukushima Nuclear Power Plant Accidents. Risk Anal. 2020;40(4):800–817. doi: 10.1111/risa.13432. [DOI] [PubMed] [Google Scholar]
- Nassios J, Giesecke J. Informing Ex Ante Event Studies with Macro-Econometric Evidence on the Structural and Policy Impacts of Terrorism. Risk Anal. 2018;38(4):804–825. doi: 10.1111/risa.12874. [DOI] [PubMed] [Google Scholar]
- New York Times (2011) One 9/11 tally: $3.3 Trillion. September 8. https://archive.nytimes.com/www.nytimes.com/interactive/2011/09/08/us/sept-11-reckoning/cost-graphic.html
- Niskanen W (1971) Bureaucracy and representative government. Aldine, Chicago. https://www.taylorfrancis.com/books/mono/10.4324/9781315081878/bureaucracy-representative-government-william-niskanen
- Oladosu G, Rose A, Lee B (2013) Economic impacts of potential foot and mouth disease agro-terrorism in the United States: a computable general equilibrium analysis. J Bioterror Biodef S12:001. 10.4172/2157-2526.S12-001
- Orbach B (2013) What is government failure. Yale J Regul Online 30:44–56. https://www.yalejreg.com/bulletin/what-is-government-failure/
- Park J, Cho J, Rose A. Modeling a Major Source of Economic Resilience to Disasters: Recapturing Lost Production. Nat Hazards. 2011;58(1):163–182. doi: 10.1007/s11069-010-9656-9. [DOI] [Google Scholar]
- Phaneuf D, Requate T (2017) A course in environmental economics: theory, policy, and practice. Cambridge University Press, New York
- Pidgeon N, Kasperson R, Slovic P. The Social Amplification of Risk. New York: Cambridge University Press; 2003. [Google Scholar]
- Rose A (2004) Economic principles, issues, and research priorities in natural hazard loss estimation. In: Okuyama Y, Chang S (eds) Modeling the spatial economic impacts of natural hazards. Springer, Heidelberg. 10.1007/978-3-540-24787-6_2
- Rose A. Economic Resilience to Disasters: Multidisciplinary Origins and Contextual Dimensions. Environ Hazards. 2007;7(4):383–398. doi: 10.1016/j.envhaz.2007.10.001. [DOI] [Google Scholar]
- Rose A (2009) Economic resilience to disasters, community and regional resilience institute report No. 8. Oak Ridge National Laboratory, Oak Ridge. https://s31207.pcdn.co/wp-content/uploads/2019/09/Economic-Resilience-to-Disasters.pdf. Accessed 5 June 2021
- Rose, Oladosu G, Lee B, Beeler Asay G (2009) A framework for analyzing and estimating the total economic impacts of a terrorist attack and natural disaster. J Homel Secur Emerg Manag 6(1):9. 10.2202/1547-7355.1399
- Rose A (2015) Macroeconomic consequences of terrorist attacks: estimation for the analysis of policies and rules. In: Mansfield C, Smith VK (eds) Benefit transfer for the analysis of DHS policies and rules. Edward Elgar, Cheltenham. 10.4337/9781784711085.00016
- Rose A (2017) Benefit-cost analysis of economic resilience actions. In: Cutter S (ed) Oxford research encyclopedia of natural hazard science. Oxford, New York. 10.1093/acrefore/9780199389407.013.69
- Rose A (2021a) Behavioral economic consequences of disasters. In: Skidmore M (ed) Handbook of natural disasters. Edward Elgar, Cheltenham
- Rose A (2021b) COVID-19 Economic impacts in perspective: a comparison to recent U.S. disasters. Int J Disaster Risk Reduct. 10.1016/j.ijdrr.2021b.102317 [DOI] [PMC free article] [PubMed]
- Rose A, Oladosu G, Lee B, Beeler Asay G (2009) The economic impacts of the 2001 terrorist attacks on the world trade center: a computable general equilibrium analysis. Peace Econ Peace Sci Public Policy 15(2):6. 10.2202/1554-8597.1161
- Rose A, Prager F, Chen Z, Chatterjee S. Economic Consequence Analysis of Disasters: The E-CAT Software Tool. Singapore: Springer; 2017. [Google Scholar]
- Rose A, Avetisyan M, Rosoff H, Burns W, Slovic P, Chan O. The Role of Behavioral Responses in the Total Economic Consequences of Terrorist Attacks on U.S. Air Travel Targets. Risk Anal. 2017;37(7):1403–1418. doi: 10.1111/risa.12727. [DOI] [PubMed] [Google Scholar]
- Rosoff H, John R, Prager F. Flu, Risks, and Videotape: Escalation of Fear and Avoidance Behavior. Risk Anal. 2012;32(4):729–743. doi: 10.1111/j.1539-6924.2012.01769.x. [DOI] [PubMed] [Google Scholar]
- Shupp R, Loveridge S, Skidmore M, Lim J, Rogers C. Risk, Loss, and Ambiguity Aversion after a Natural Disaster. Econ Dis Cli Cha. 2017;1(2):121–142. [Google Scholar]
- Shupp R, Loveridge S, Skidmore M, Lim J, Rogers C. Trust and patience after a tornado. Weather Clim Soc. 2017;9(4):659–668. doi: 10.1175/WCAS-D-16-0135.1. [DOI] [Google Scholar]
- Slovic P. Perception of risk. Science. 1987;236(4799):280–285. doi: 10.1126/science.3563507. [DOI] [PubMed] [Google Scholar]
- Straub AM. Natural disasters don’t kill people, governments kill people: Hurricane Maria, Puerto Rico–recreancy, and risk society. Nat Hazards. 2020;105:1603–1621. doi: 10.1007/s11069-020-04368-z. [DOI] [Google Scholar]
- Sunstein C, Thaler R (2008) Nudge: improving decisions about health, wealth, and happiness. Yale University Press, New Haven
- U.S. EPA Science Advisory Board (2017) SAB advice on the use of economy-wide models in evaluating the social costs, benefits, and economic impacts of air regulations. Report no. EPA-SAB-17-012. Washington, DC
- U.S. EPA Science Advisory Board (2021) SAB peer review of the epa's revised guidelines for preparing economic analysis. Report no. EPA-SAB-21-002. Washington, DC
- U.S. Office of Management and Budget (OMB) (2003) Circular A-4: regulatory analysis. executive office of the president of the United States. Washington, DC
- von Winterfeldt D, O’Sullivan TM (2006) Should we protect commercial airplanes against surface-to-air missile attacks by terrorists? Decis Anal 3(2):63–75. 10.1287/deca.1060.0071
- von Winterfeldt D, Farrow S, John R, Eyer J, Rose A, Rosoff H. Assessing the benefits and costs of homeland security research: a risk-informed methodology with applications for the U.S. Coast Guard. Risk Anal. 2020;40(3):450–75. doi: 10.1111/risa.13403. [DOI] [PubMed] [Google Scholar]
- Walmsley T, Rose A, Wei D (2021a) Impact on the U.S. macroeconomy of mandatory business closures in response to the COVID-19 pandemic. Appl Econ Lett 28/1528(15):1293–1300. 10.1080/13504851.2020.1809626
- Walmsley T, Rose A, Wei D (2021b) The impacts of the coronavirus on the economy of the United States. Econ Dis Cli Cha 5(1):1–52. 10.1007/s41885-020-00080-1 [DOI] [PMC free article] [PubMed]
- Waugh WL Jr (2006) The political costs of failure in the Katrina and Rita disasters. Ann Am Acad Political Soc Sci 604(1):10–25. 10.1177/0002716205284916
- Wei D, Chen Z, Rose A. Evaluating the Role of Resilience in Recovering from Major Port Disruptions: A Multi-Regional Analysis. Pap Reg Sci. 2020;99(6):1691–1722. doi: 10.1111/pirs.12553. [DOI] [Google Scholar]
- Whitehead JC. One Million Dollars Per Mile? The Opportunity Costs of Hurricane Evacuation. Ocean Coast Manag. 2003;46(11–12):1069–1083. doi: 10.1016/j.ocecoaman.2003.11.001. [DOI] [Google Scholar]
- Xie W, Rose A, Li S, He J, Li N, Ali T, Wei W. Dynamic Economic Resilience and Economic Recovery from Disasters: A Quantitative Assessment. Risk Anal. 2018;38(6):1306–1318. doi: 10.1111/risa.12948. [DOI] [PubMed] [Google Scholar]
- Zhao M, Rosoff H, John R. Media Disaster Reporting Effects on Public Risk Perception and Response to Escalating Tornado Warnings: A Natural Experiment. Risk Anal. 2019;39(3):535–552. doi: 10.1111/risa.13205. [DOI] [PubMed] [Google Scholar]
- Zhou L, Chen Z. Are CGE Models Reliable for Disaster Impact Analyses? Econ Syst Res. 2021;33(1):20–46. doi: 10.1080/09535314.2020.1780566. [DOI] [Google Scholar]
Associated Data
This section collects any data citations, data availability statements, or supplementary materials included in this article.
Data Availability Statement
No data sets are used in this manuscript.