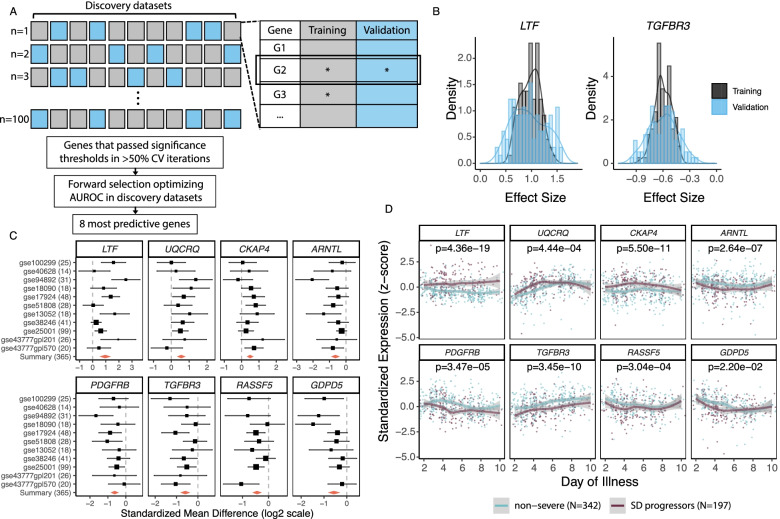
Fig. 1.
Multi-cohort analysis identifies eight genes robustly associated with progression to SD. A Schematic of multi-cohort analysis method with Monte Carlo sampling at the dataset level. In each of 100 cross-validation (CV) iterations, we randomly selected seven datasets for “training” (gray), identified differentially expressed genes (DEGs) using MetaIntegrator, and examined them in the remaining four “validation” (blue) datasets. DEGs that passed significance thresholds (as denoted by asterisks) in both training and validation were considered significant for that iteration. We then did a greedy forward search on DEGs significant in greater than 50% of all iterations and identified the eight most predictive DEGs. B Representative plots of the distribution of effect size (log2) in training (gray) and validation (blue) across the 100 iterations for over-expressed (LTF) and under-expressed (TGFBR3) genes that passed significance thresholds in >50% of iterations. Regardless of the combination of datasets in training or validation, the distribution of effect sizes for all 25 genes did not contain 0. C Forest plot of the effect size of the eight genes in each discovery dataset. Two genes (RASSF5 and GDPD5) were not measured in every dataset. The black lines indicate the 95% confidence interval (CI) of the effect size for a given gene in a given dataset, and the size of the black box is proportional to the sample size of each dataset. The summary effect size of each gene across all datasets is indicated by the red diamond; the width of the diamond indicates the 95% CI. D Standardized expression of each of the eight genes over the disease course (days post-symptom onset) in patients who remained non-severe (blue) or progressed to SD (purple). Seven discovery datasets that reported day of sample collection were included in longitudinal analysis. Lines represent the local regression (LOESS) curve fit for non-severe patients and SD progressors. Gray bands represent the 95% CI

