Fig. 2.
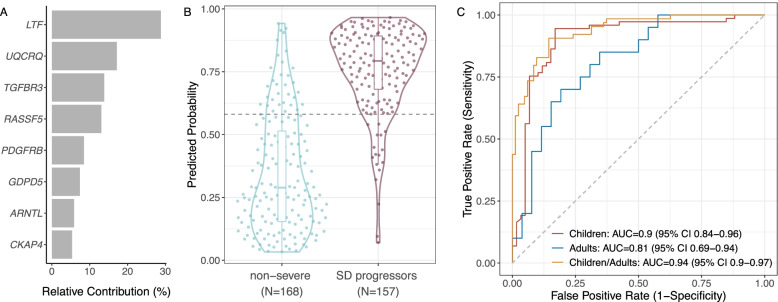
The 8-gene XGBoost-based model predicts progression to SD in public datasets. A Relative contribution of each of the eight genes to the XGBoost model. B Violin plot of predicted probabilities of progression to SD for samples across all public datasets. The dotted horizontal line indicates the Youden optimal threshold for the public datasets. C ROC curves of the 8-gene model predictions for distinguishing non-severe patients from SD progressors in datasets profiling children (red), adults (blue), or both children and adults (orange). The DeLong test p-value for children vs. adults is 0.205

