Figure 3.

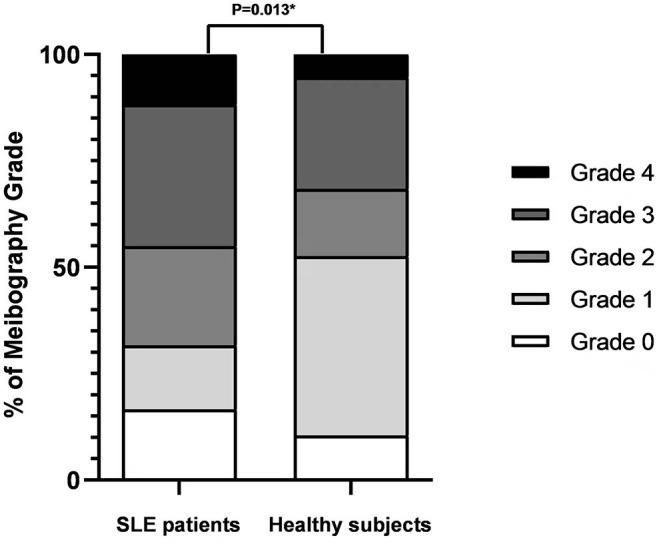
Meiboscale of Pult score distribution for SLE patients and healthy subjects. Bars represent the percentage of participants within each meibography grade. Asterisks denote statistically significant difference (P < 0.05).

Meiboscale of Pult score distribution for SLE patients and healthy subjects. Bars represent the percentage of participants within each meibography grade. Asterisks denote statistically significant difference (P < 0.05).