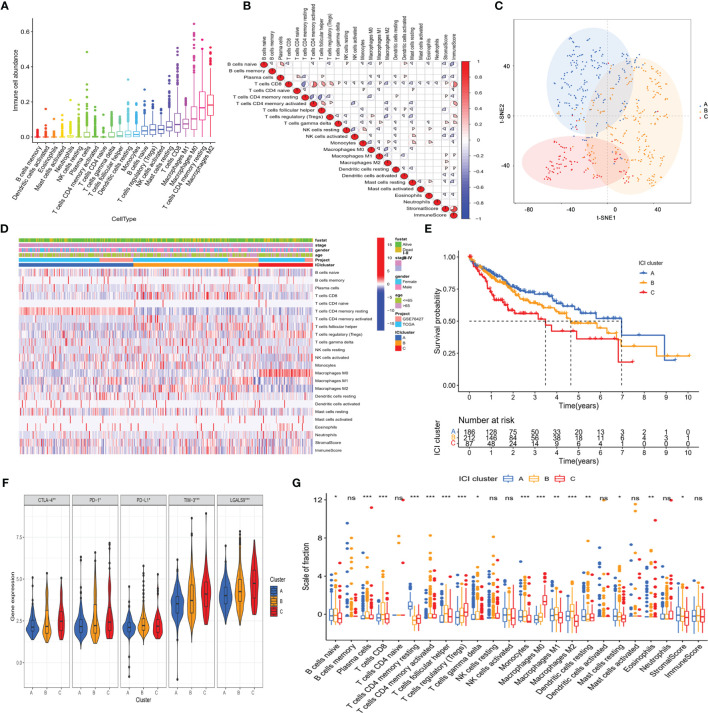
Figure 2.
The landscape of immuno-cell infiltration in the TME of HCC. (A) Comparison of the abundance of 22 tumor-infiltrating immune cells. (B) Correlation between the abundance of 22 tumor-infiltrating immune cells and Immune scores as well as Stromal scores. (C) Confirmation of the clustering patterns using the t-SNE algorithm. (D) Unsupervised clustering for all HCC patients based on the proportion of immune cells. (E) Kaplan–Meier survival analysis of three immune infiltration clusters. (F) Comparison of the expression of immune checkpoints among distinct immune infiltration clusters. * p < 0.05; ** p < 0.01; *** p < 0.001. (G) Comparison of fraction of tumor-infiltrating immune cells in immune infiltration clusters. * p < 0.05; ** p < 0.01; *** p < 0.001; ns, not significant.

