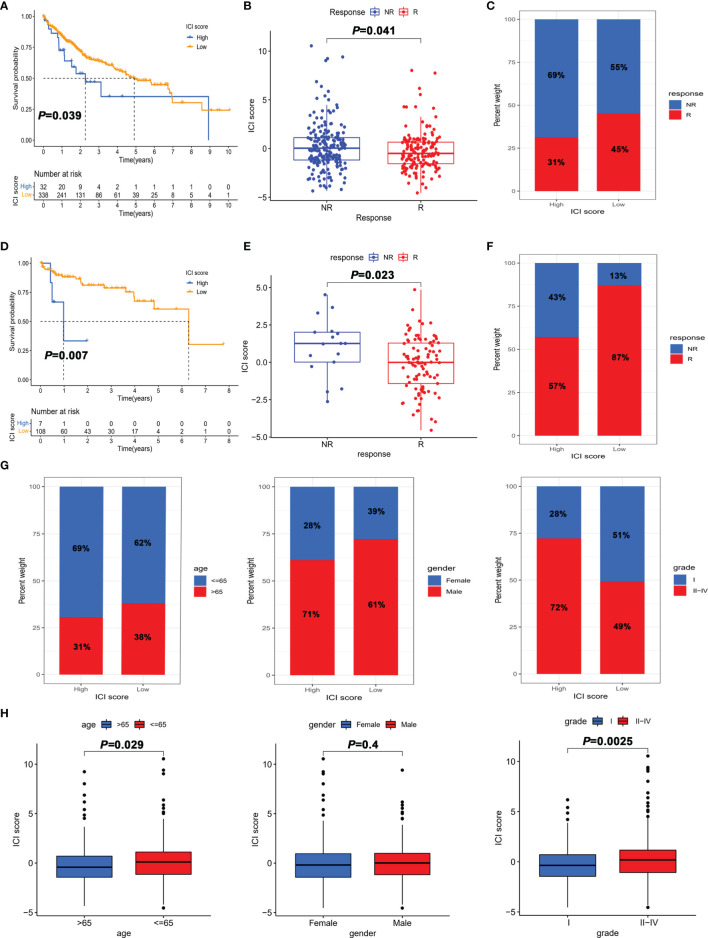
Figure 5.
The role of the ICI score in the prediction of immunotherapeutic benefits. (A) Kaplan–Meier curves for patients with high and low ICI score in the TGCA-LIHC cohort. (B) Comparison of the ICI score in response and non-response to immunotherapy in the TGCA-LIHC cohort. (C) Percentage of objective response rate to immunotherapy for high score and low score groups in the TGCA-LIHC cohort. (D) Kaplan–Meier curves for patients with high and low ICI scores in the GSE76427 cohort. (E) Comparison of ICI scores in response and non-response to immunotherapy in the GSE76427 cohort. (F) Percentage of objective response rate to immunotherapy for the high score and low score groups in the GSE76427 cohort. (G) Percentage of clinical parameters for high score and low score groups. (H) Comparison of clinical parameters between high score and low score groups.

