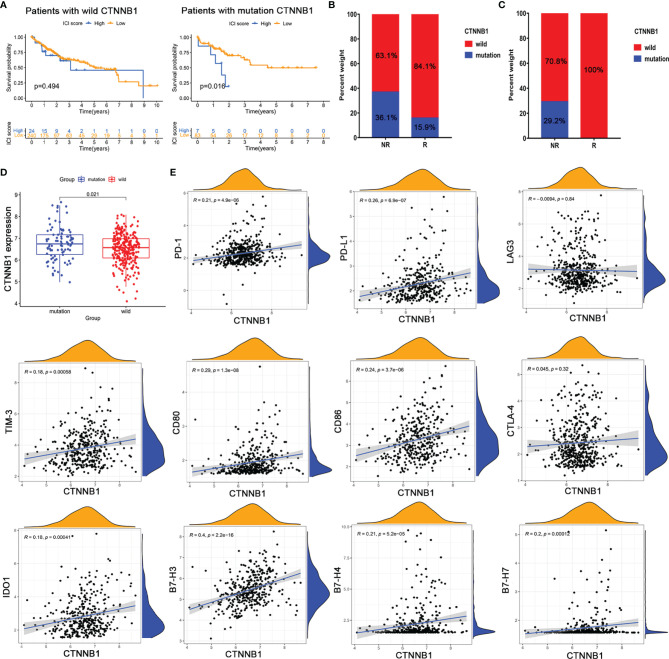
Figure 7.
(CTNNB1 mutation might be predictive of response to immunotherapy. Kaplan–Meier survival curve of the (A) CTNNB1 wild-type group and (B) CTNNB1 mutation group in TCGA-LIHC. (C) CTNNB1 mutation status in the response and non-response groups from TCGA-LIHC (left) and cBioPortal database (right). (D) Comparison of the expression of CTNNB1 in wild-type and mutant groups. (E) Correlation between CTNNB1 expression and T-cell checkpoint expressions.

