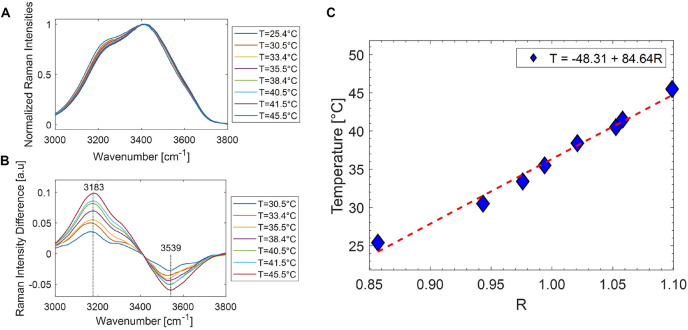
FIGURE 4.
(A) Raman water bands in the 3,000- to 3,800-cm−1 spectral range, normalized to the prominent feature at 3,400 cm−1, obtained at different temperatures. When temperature increases, the low wavenumber side decreases accordingly. (B) Difference in the spectra reported in part A with respect to the corresponding one at 25.4°C. (C) Trend of the ratio R vs. T, together with the line corresponding to a linear fitting of the data. The calibration line equation is also indicated.

