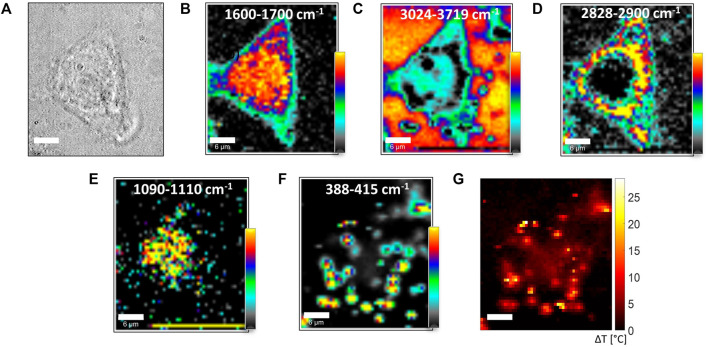
FIGURE 7.
(A) Bright-field image of an MCF7 cell exposed to 2D-MoS2. (B–F) Integrated intensity of selected bands obtained in a raster scanning of a 30-μm × 30-μm region with a 600-nm step. P R and τ were 30 mW and 2 s, respectively, so the whole image was acquired in ∼ 83 min. Confocal Raman section was acquired in a plane, cutting through the nucleus, at ∼ 5 μm from the glass interface. The labels in each panel correspond to the spectral regions selected for band intensity integrations. Color scales are relative scales, with the darker and brighter colors corresponding to the lowest and highest integrated intensity values, respectively. Such maps provide information on the spatial distribution of proteins (panel B), water (panel C), lipids (panel D) DNA (panel E), and 2D-MoS2 (panel F). (G) Temperature increase of the analyzed cell obtained starting from the estimation of the R ratio in the scanned region.

