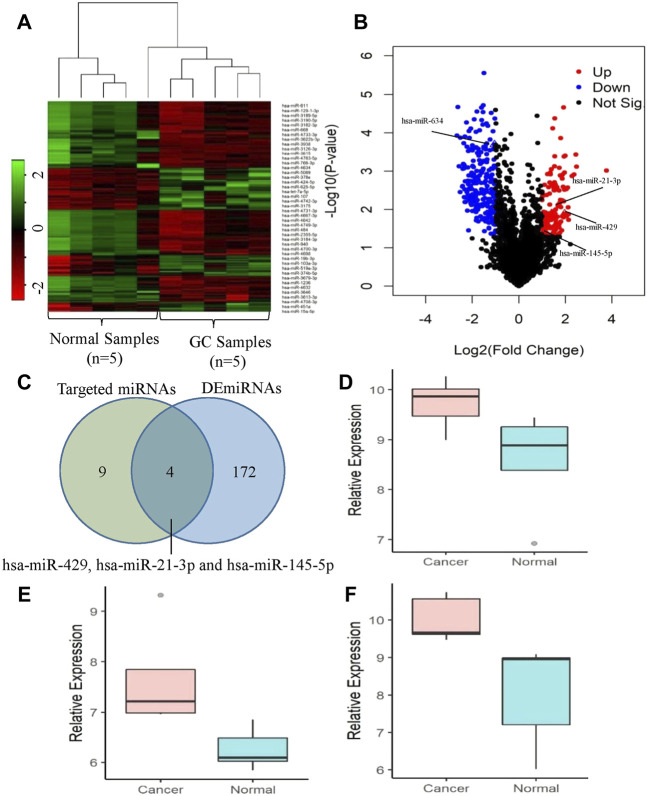
FIGURE 6.
Expression analysis of the targeted miRNAs of the circRNAs circCEACAM5 and circCOL1A1. (A) Clustered heatmap represents the expression profile of the DE miRNAs in GC compared to normal tissues. The color scale indicates the Log2FoldChange of the expression value for each miRNA in cancers vs normal tissues. Red color implies down-regulation while green color indicates up-regulation. (B) Volcano plot of the DE miRNAs in GC relative to normal tissues. Red, blue and black dots indicate up-regulation, down-regulation and not significant respectively. (C) Identification of the potential target miRNAs of the circRNAs circCEACAM5 and circCOL1A1. Expression levels of (D) hsa-miR-429, (E) hsa-miR-21-3p and (F) hsa-miR-145-5p in GC compared to normal tissues.

