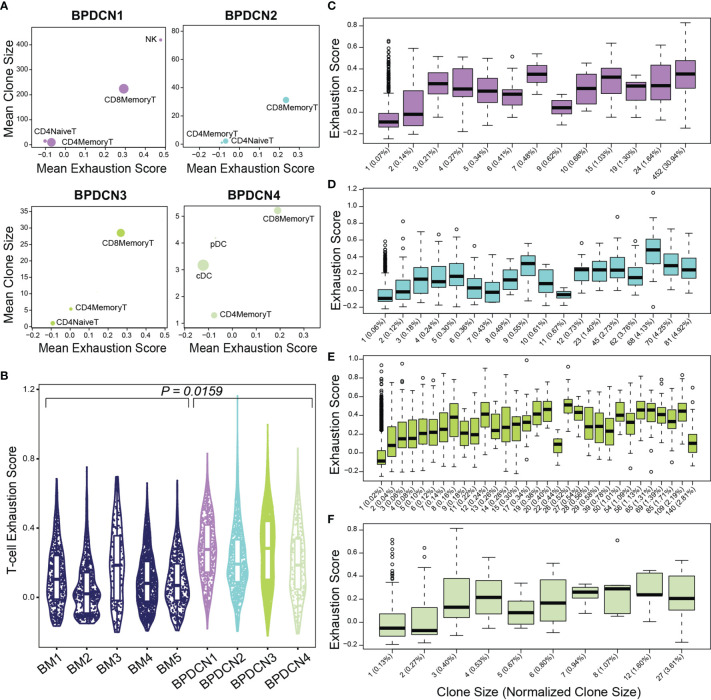
Figure 8.
Exhaustion scores positively correlate with clone size in BPDCN samples. (A) Scatter plots show mean exhaustion score per cluster (x-axis) versus mean clone size (y-axis). Dots are scaled by the number of cells of each cluster in the dataset. (B) Violin plot shows T-cell exhaustion signature scores in CD8+ Memory T-cells in healthy controls (BM 1-5) and BPDCN samples with T-cells (BPDCN 1-4). (C–F) Box plots of cells binned by TCR clone size (x-axis) versus exhaustion score (y-axis) for T-cells in each BPDCN 1-4 sample as C-F. Parenthetical values on the x-axis labels indicate the normalized clone size.

