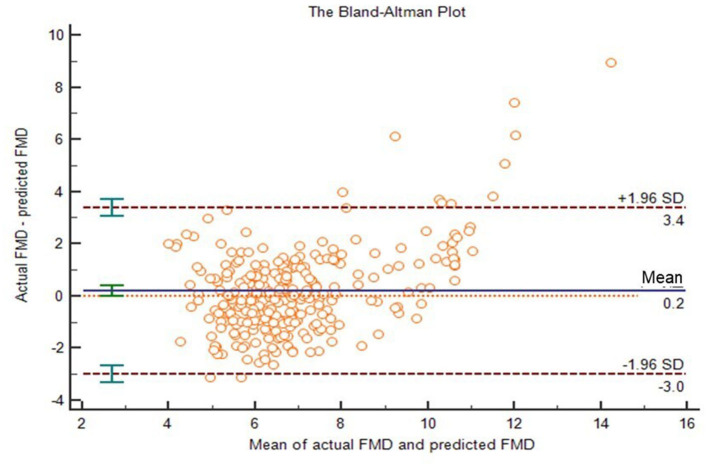
Figure 5.
The Bland-Altman plot of actual FMD and predicted FMD. The upper and lower horizontal dotted lines in the picture represented the 95% limits of agreement. The horizontal solid line in the middle represented the average value of the difference. The middle horizontal dotted line indicated the position where the average value of the difference was zero.

