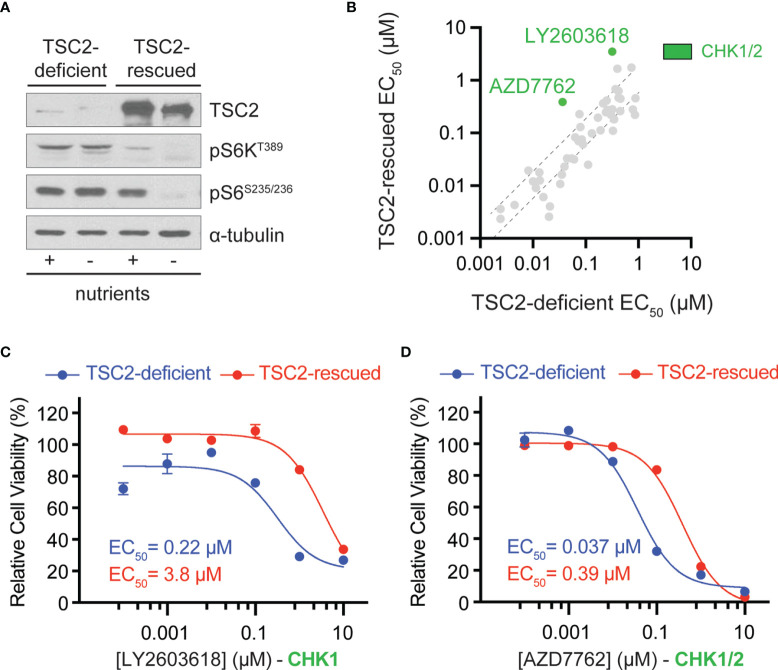
Figure 1.
Chemical compound screen identifies sensitivity to checkpoint kinase inhibition in TSC2-deficient cells. (A) Western blots from TSC2-deficient (621-102) or TSC2-rescued (621-103) cells cultured with (+) or without (-) nutrients. (B) Scatter plot of EC50 values after chemical compound screens in TSC2-deficient (x-axis) vs. TSC2-rescued (y-axis) cells with >60% reduction in viability and an EC50 value <1 µM in TSC2-deficient cells; dashed black lines represent the 99% confidence interval for the linear regression. CHK1/2, checkpoint kinase 1/2, inhibitors (green). (C, D) Dose–response curves for the indicated CHK inhibitors LY2603628 (C) and AZD7762 (D) in TSC2-deficient (blue) or TSC2-rescued cells (red) after 72 h; data are presented as mean ± s.e.m (n = 3).

