Figure 3.

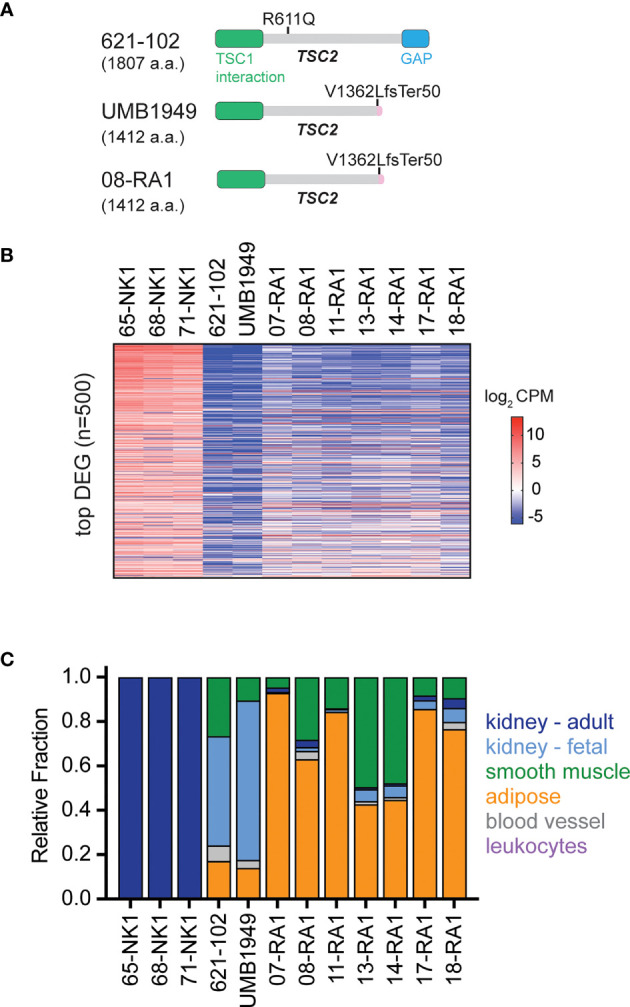
Molecular characterization of TSC cellular models. (A) Schematic for TSC2 protein structure in TSC2-deficient cell lines (621-102 and UMB1949) or 08-RA1 patient renal angiolipoma (RA) tumor; GAP, GTPase-activating protein. TSC2 deletion in patient-derived UMB1949 and renal angiomyolipoma 08-RA1. (B) Top 500 most differentially expressed genes (DEG), sorted high (top) to low (bottom) across the indicated samples and colored by log2 CPM according to the indicated scale. (C) The relative fraction of gene signatures estimated by CIBERSORT (gray, blood vessel; green, smooth muscle; orange, adipose; light blue, fetal kidney; dark blue, adult kidney; leukocytes purple).
