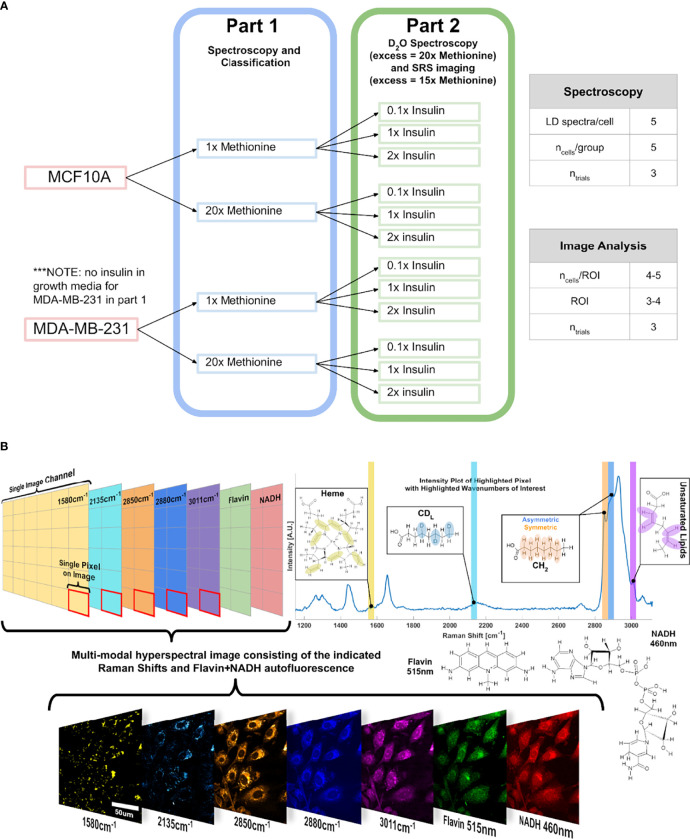
Figure 10.
Experimental Design and Points of Interest A Experimental design illustration of the groups in this study. Only methionine concentration is modulated at first, and then insulin and methionine were modulated in tandem. DMEM used in this experiment already contains 0.03g/L of L-methionine, which corresponds to the 1x methionine group. NOTE: in part 2, the excess methionine concentration is 20x for the Raman spectroscopy, and 15x for SRS imaging. (B) Points of interest where SRS images relating to lipid metabolism are acquired, related to the lipidomic investigation. Hyperspectral Image (HSI) format is shown conceptually to convey the multi-modal approach to quantitative optical analysis. Vibrational modes are color coded, with an example image of a HSI of MCF10A control cells.

