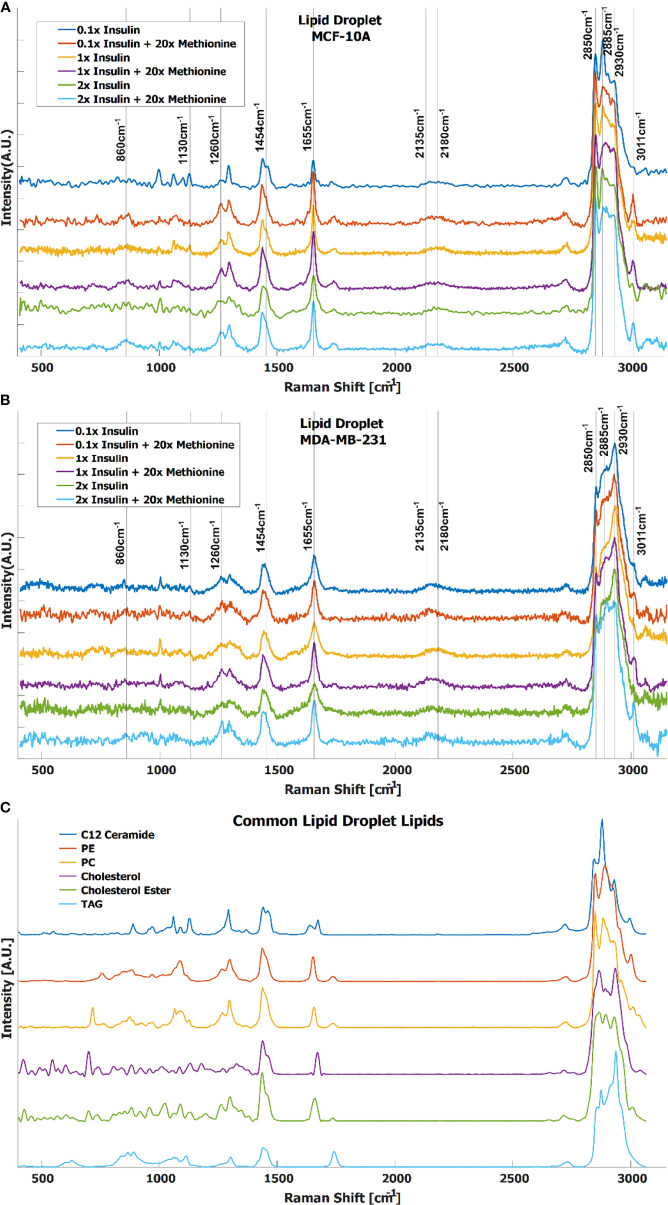
Figure 3.
Average spectra of LD from (A) MCF-10A and (B) MDA-MB-231 cells under various methionine and insulin concentrations. Manual identification of potential Raman peak targets is highlighted with vertical lines and labels. For example, the CDLipid peak in the cell silent region at 2135cm-1 has a noticeable increase relative to the CDProtein peak at 2180cm-1 in the excess methionine groups. This could indicate preference for de novo lipogenesis in excess methionine environments. (C) Raman spectra of common lipid species in LD, in descending order of prevalence.

