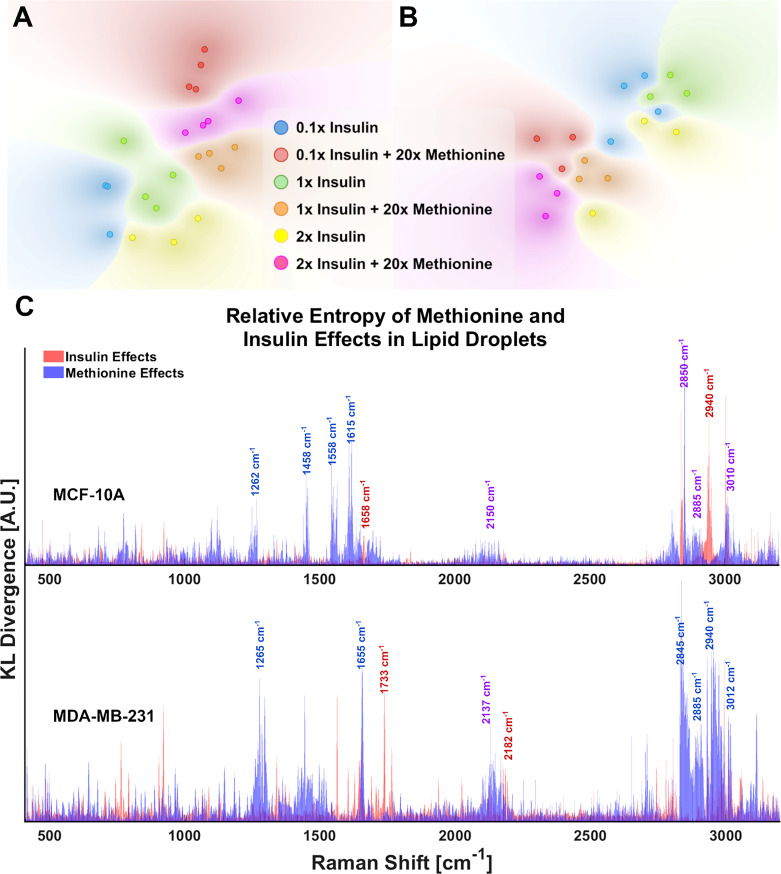
Figure 4.
LD chemometric data is sufficient to discriminate cell phenotype (A) tSNE separates experimental groups for MCF-10A and (B) MDA-MB-231 tSNE plots of the top 10 PCs from PCA of LD spectra. Global structure is preserved, and no exaggeration was applied. Each point represents the average of 5 LD spectra taken from a single cell of the corresponding sample. (C) Relative entropy provides a metric for ranking features (Raman peaks) by their ability to classify the spectra as belonging to 20x methionine or 1x methionine groups, as well as 0.1x, 1x, 2x insulin groups. Raman peaks that appear to be influential in both classification schema are denoted in purple text labels for clarity. These cell subtype plots are aligned manually for clarity. Subplots are not generated in such a fashion automatically.

