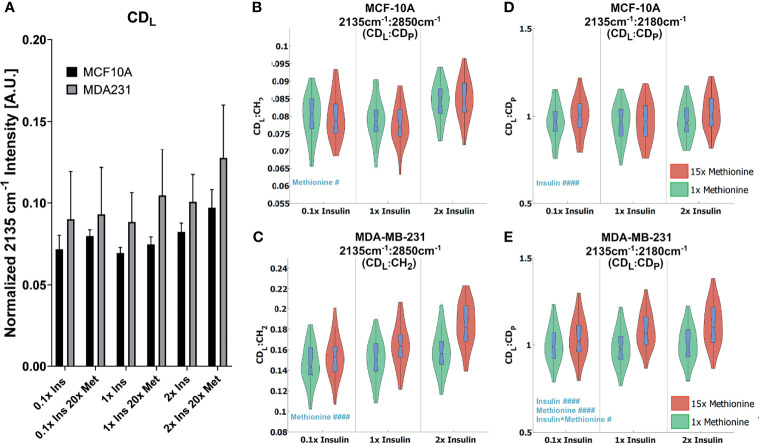
Figure 5.
Quantitative de novo lipid synthesis (A) Normalized CDL intensities show excess methionine stimulates de novo lipogenesis. (B, C) CDL Ratios show violin box-plots of de novo lipid synthesis CDL ratios for MCF10A and MDA-MB-231, respectively. CDL : CH2 illustrates the relative de novo lipid synthesized to total ascribable lipid content. Balanced 2-way ANOVA with constrained sum of squares results of CDL ratios shows methionine concentration significantly influenced the CDL: CDP ratio in both MCF10A and MDA-MB-231 lipid droplet spectra with rejection levels of #P < 0.05 and ####P < 0.0001, respectively. (D, E) CDL: CDP illustrates the relative de novo lipid and protein synthesized biomolecules for MCF10A and MDA-MB-231, respectively. Values were taken from spectra of lipid droplets only. while. There was no significant evidence of interactions between these two independent variables for these ratios. Balanced 2-way ANOVA with constrained sum of squares results of CDL ratios indicate insulin significantly influenced the CDL: CH2 ratio in MCF-10A lipid droplet spectra with a rejection level of ####P < 0.0001, but no significant evidence of interactions between these two independent variables. However, in TNBC insulin, methionine, and the interaction term significantly influenced the CDL : CH2 ratio in MDA-MB-231 lipid droplet spectra with a rejection level of ####P < 0.0001 and #P < 0.05 for the individual and interaction terms, respectively.

