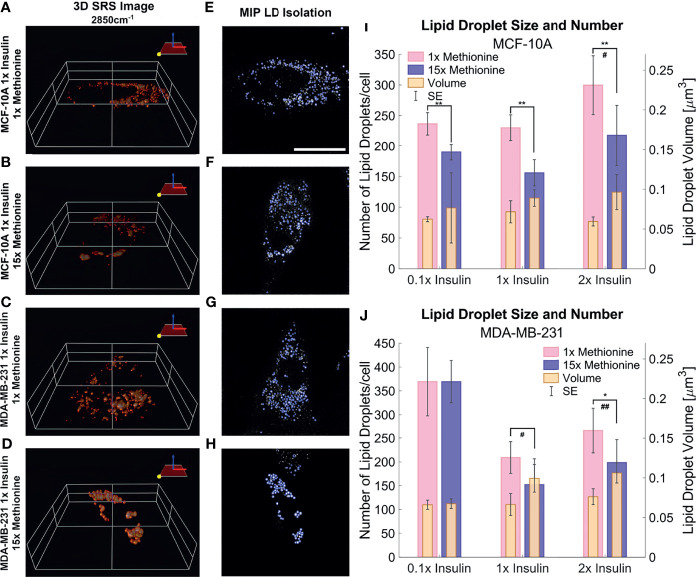
Figure 6.
3D SRS image lipid droplet analysis (A–D) 3D isosurface reconstructions of the single cell SRS images taken at 2850cm-1. (E–H) LD segmentation shows representative maximum intensity projections of SRS image stacks shown in (A–D) with lipid droplets highlighted in blue outlines. (I, J) Quantitative LD structure summary shows average lipid droplet number and volume for each experimental group. Excess methionine groups display decreased lipid droplet number and increased size. Lipid droplets also appear qualitatively more clustered in excess methionine as well. Scale bar is 20 µm. Two-tailed t-tests were performed between each pair of bars to highlight excess methionine effects. Asterisks ‘*’ correspond to the following p-values for LD number: *P < 0.05, **P < 0.01. Octothorps ‘#’ correspond to the following p-values for LD volume: #P < 0.05, ##P < 0.01. Scale bar is 20 µm.

