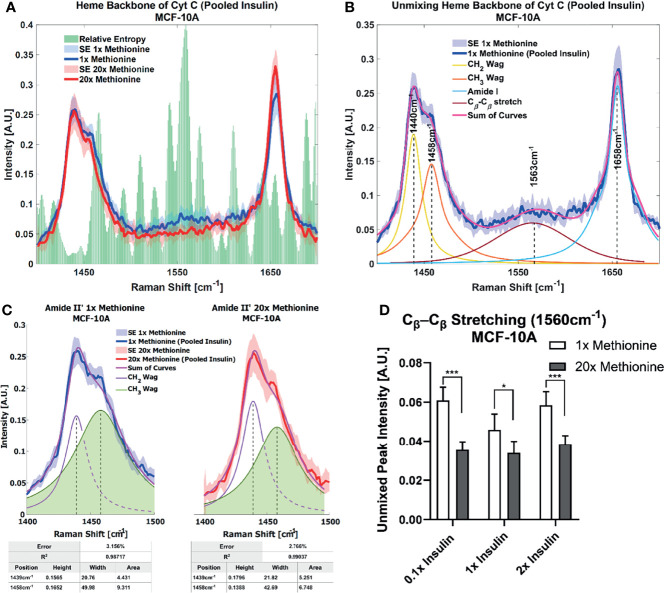
Figure 7.
Spontaneous Raman Spectroscopy detects CytC presence and protein folding (A) normal vs excess methionine Expanded view of lipid droplet spectra grouped by methionine concentration shows a high relative entropy in the 1550cm-1 region, ascribable to the heme backbone of cytochrome C. (B) Unmixing Peaks with four peaks using a Gaussian-Lorentzian blend yields an error of 2.367% and an R2 of 0.98854. (C) Amide II’ Peak Shoulder shows an expanded view of normal and excess methionine groups’ Amide II’ regions highlight a relatively narrowed shoulder at 1458cm-1. Unmixed peaks follow the overall shape of the average Amide II’ peaks, with the error and correlation coefficient reported in the table below. Width and area information is also summarized in the table to clearly communicate the disparate shoulder widths. (D) Quantitative summary of the heme backbone unmixed peak intensities for each experimental condition of MCF-10A cultures shows decreased spectral presence. Two-tailed t-tests were performed between each pair of bars to highlight excess methionine effects. Asterisks ‘*’ correspond to the following p-values: *P < 0.05, ***P < 0.001.

