Figure 8.
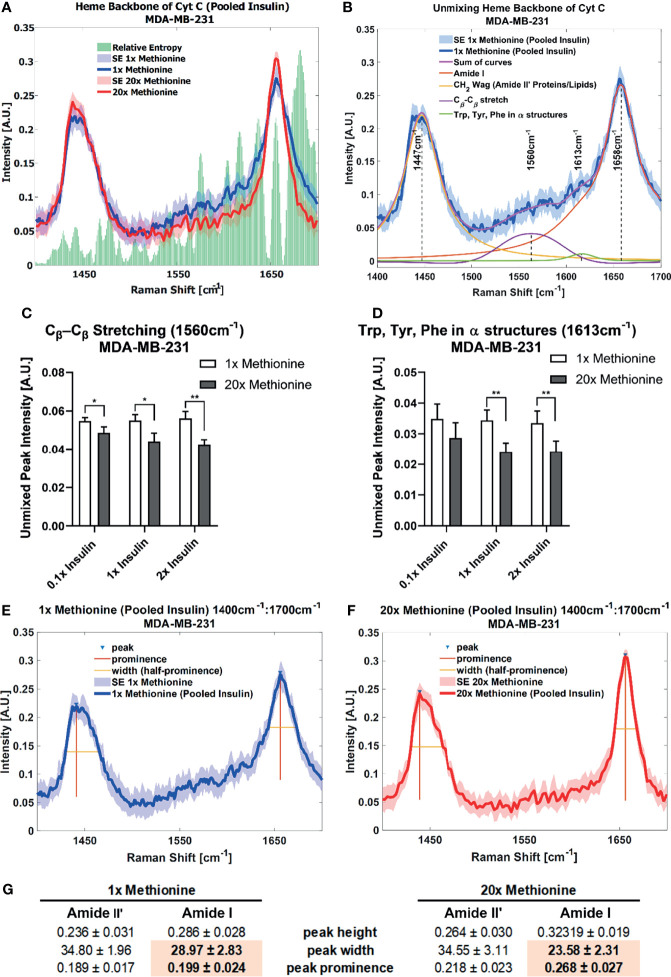
Spontaneous Raman Spectroscopy detects CytC presence and protein folding differences (A) normal vs excess methionine shows expanded view of lipid droplet spectra grouped by methionine concentration shows a high relative entropy in the 1550cm-1 and 1650cm-1 regions, ascribable to the heme backbone of cytochrome C and side chains of tryptophan, tyrosine, and phenylalanine, respectively. (B) Unmixing peaks with four peaks using a Gaussian-Lorentzian blend yields an error of 2.620% and an R2 of 0.98544. (C, D) Quantitative summary of the unmixed peak intensities for each experimental condition of MDA-MB-231 cultures shows decreased spectral presence of cytochrome C. (E, F) Amide I peak width shows an expanded view of lipid droplet from 1x Methionine (LEFT), and 20x Methionine (RIGHT) experimental conditions. Two-tailed t-tests were performed between each pair of bars to highlight excess methionine effects. Asterisks ‘*’ correspond to the following p-values: *P < 0.05, **P < 0.01. (G) Peak analysis shows that the peak prominence and peak width at half prominence is significantly narrower at the Amide I region in excess methionine lipid droplet spectra.

