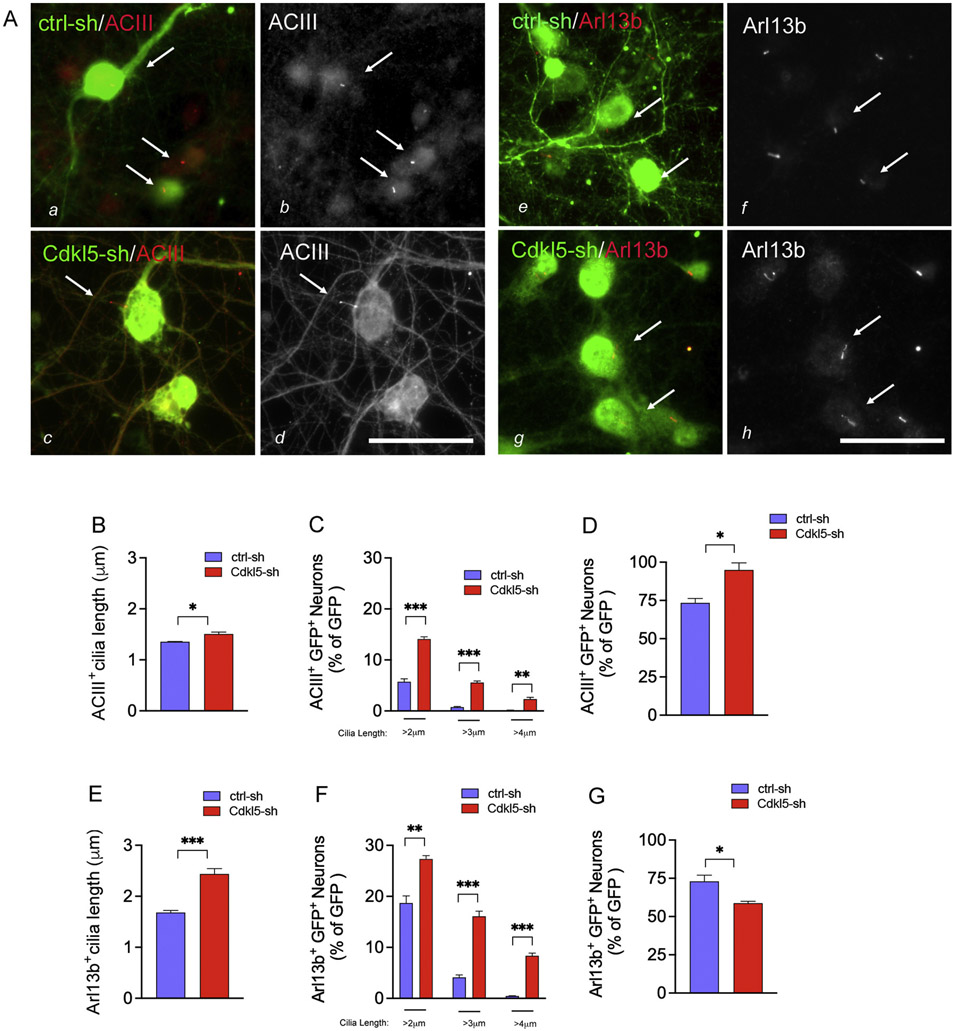
Fig. 2. Loss of neuronal Cdkl5 activity results in elongated ACIII+ and Arl13b+ cilia.
(A) Representative immunofluorescence images of ACIII (a–d) and Arl13b cilia in ctrl-sh and Cdkl5-sh neurons (e–h) fixed at DIV13. Merged images show the GFP+ LV-infected neurons (green in a, c, e, g), the ACIII+ cilia (red in a, c; greyscale in b, d) and the Arl13b+ cilia (red in e, g; greyscale in f, h). White arrows indicate cilia. Bar is 50μm. Quantification of the average length of all cilia in the GFP+ neurons (ACIII+ cilia in B; Arl13b+ cilia in E. Percent of GFP + neurons with cilia above 2, 3 and 4 μm length (ACIII+ cilia in C; Arl13b+ cilia in F). Percent of GFP + neurons with cilia above 1 μm length. Data represent GFP+ ACIII+ (in D) and GFP+ Arl13b+ (in G) neurons as percent of GFP+ cells. Data represent n = 12–24 biological replica/experiment, n = 3 experiments/condition, error bars indicate ± SEM (unpaired t-test *p < 0.05, **p < 0.01, ***p < 0.0005).

