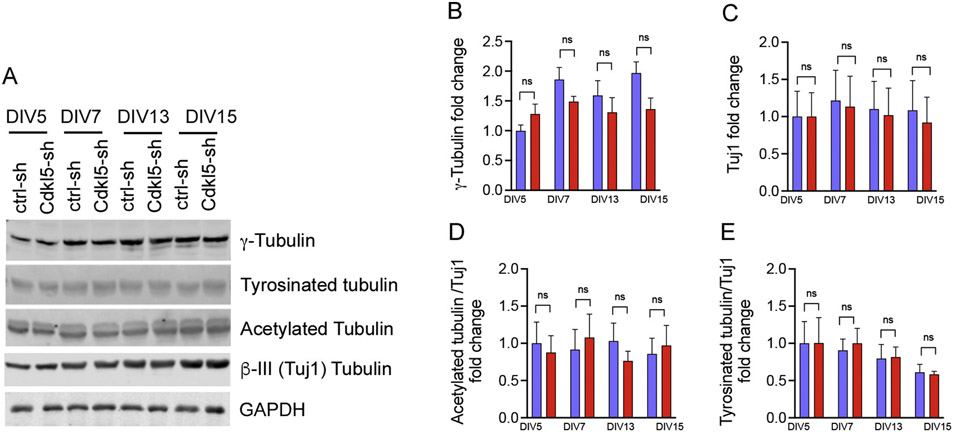
Fig. 3. Cdkl5 knockdown neurons display no change in tubulin expression and post-translational modification.
(A) Representative western blot of ctrl-sh and Cdkl5-sh lentiviral vectors in a time course experiment at DIV5, 7, 13 and 15. Quantification of γTubulin (n = 3, in (B), Tuj1 (n = 4, in C), Acetylated tubulin (n = 4, in D), and Tyrosinated tubulin (E n = 3), Data are average fold changes of ctrl-sh neurons. GAPDH was used as loading control for protein level normalization. Quantifications are relative to ctrl-sh neurons (unpaired Student’s ns = not significant, error bars indicate ± SEM).

