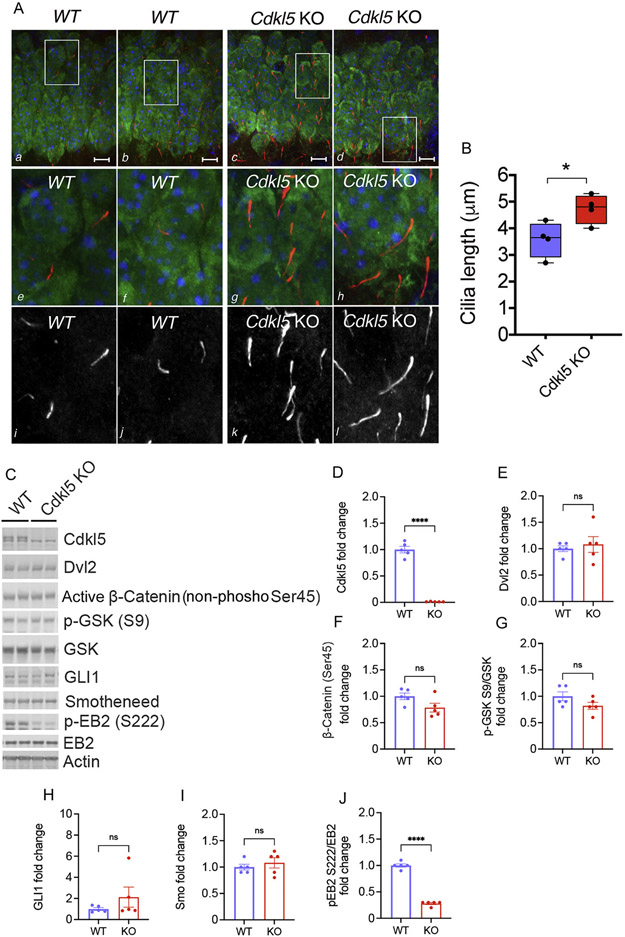
Fig. 4. Cdkl5 mice have increased cilia length but no changes in components of Wnt and sonic hedgehog signaling pathway.
A. Representative confocal images of the hippocampal CA1 region of WT and Cdkl5 KO mice at P15 stained with the cilia marker ACIII (in red a–h; in greyscale i–l), with the neuronal marker NeuN (in green a–h) and with the nuclei marker Hoechst (in blue a–h). White boxes in a–d represent the regions for zoom in e–l. Scale bar is 10μm. B. Cilia Length quantification. Data are average cilia length (n = 500 average cilia /mouse *p < 0.05 n=4 mice/genotype). C. Representative western blot of protein lysates from brains of control and Cdkl5 KO mice. Quantification of Dvl2 (E n = 5), active β-catenin (non-phosphorylated at S45) (F n = 5), p-GSK (G n = 5), GLI1 (H n = 5), Smo (I n = 5). Loss of Cdkl5 expression and function is shown by reduced Cdkl5 protein level (D n = 5) and EB2 phosphorylation (J n = 5). β-actin was used as loading control for protein level normalization. Phospho-antibodies levels were quantified as the ratio to their respective total antibody after protein normalization to β-actin. Quantifications are relative to ctrl-sh neurons (n = 5 unpaired Student’s t test, ****p < 0.00001, ns = not significant). Error bars indicate ± SEM.

