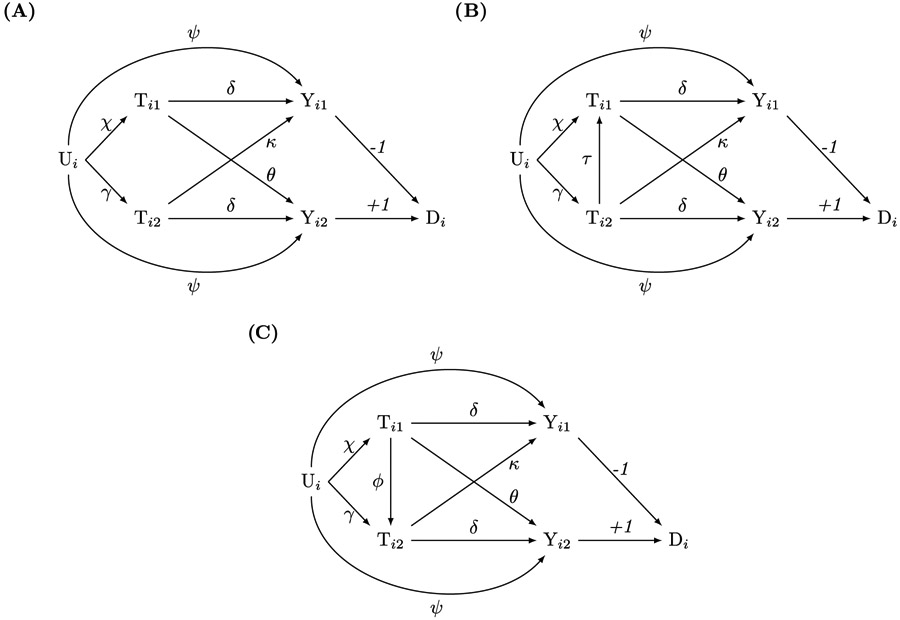
Figure 2.

Causal directed acyclic graphs for linear data-generating models with two-sided exposure-to-outcome sibling spillover. Subscripts i and j denote family and sibling, respectively. Tij is the exposure, Yij is the outcome, Di is the gain-score, and Ui is an unobserved family-level confounder. Greek letters denote effects. (2A) does not have exposure-to-exposure spillover, whereas (2B) and (2C) have exposure-to-exposure spillover. The gain-score method identifies the differences between the spillover effects θ (Ti1 → Yi2) and κ (Ti2 → Yi1) in all three models.
