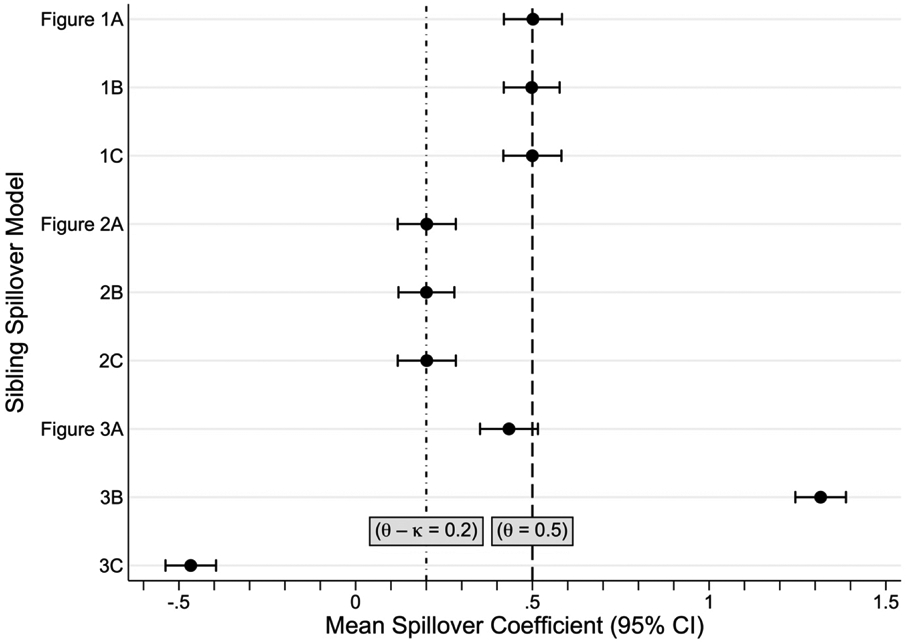
Figure 4.

Results (average spillover coefficients and empirical 95% confidence intervals [CI]) from simulations of the nine sibling spillover models in Figures 1-3. Each simulation consisted of 1000 runs of 5000 observations, where each observation represented a sibling pair (i.e., family). Subscripts i and j indicate family and sibling, respectively. Tij is the exposure and Yij is the outcome. The target quantity is the spillover effect (Ti1 → Yi2), set to θ = 0.5 in all models. Other spillover effects include κ (Ti2 → Yi1), τ (Ti2 → Ti1), φ (Ti1 → Ti2), ψ (Yi1 → Ti2), η (Yi1 → Yi2), and λ (Yi2 → Yi1). Except for θ, all spillover parameters were set to zero except in the following cases: κ = 0.3 in Figures 2A-C; τ = 0.3 in Figures 1B and 2B; φ = 0.3 in Figures 1C and 2C; ω = 0.3 in Figure 3A; η = 0.3 in Figure 3B; and λ = 0.3 in Figure 3C. The spillover coefficient identifies (i.e., is unbiased) for θ in all models of one-sided spillover (Figure 1); identifies the difference between the two exposure-to-outcome spillover effects with two-sided spillover (Figure 2); and is biased in the presence of spillovers originating from outcomes (Figure 3).
