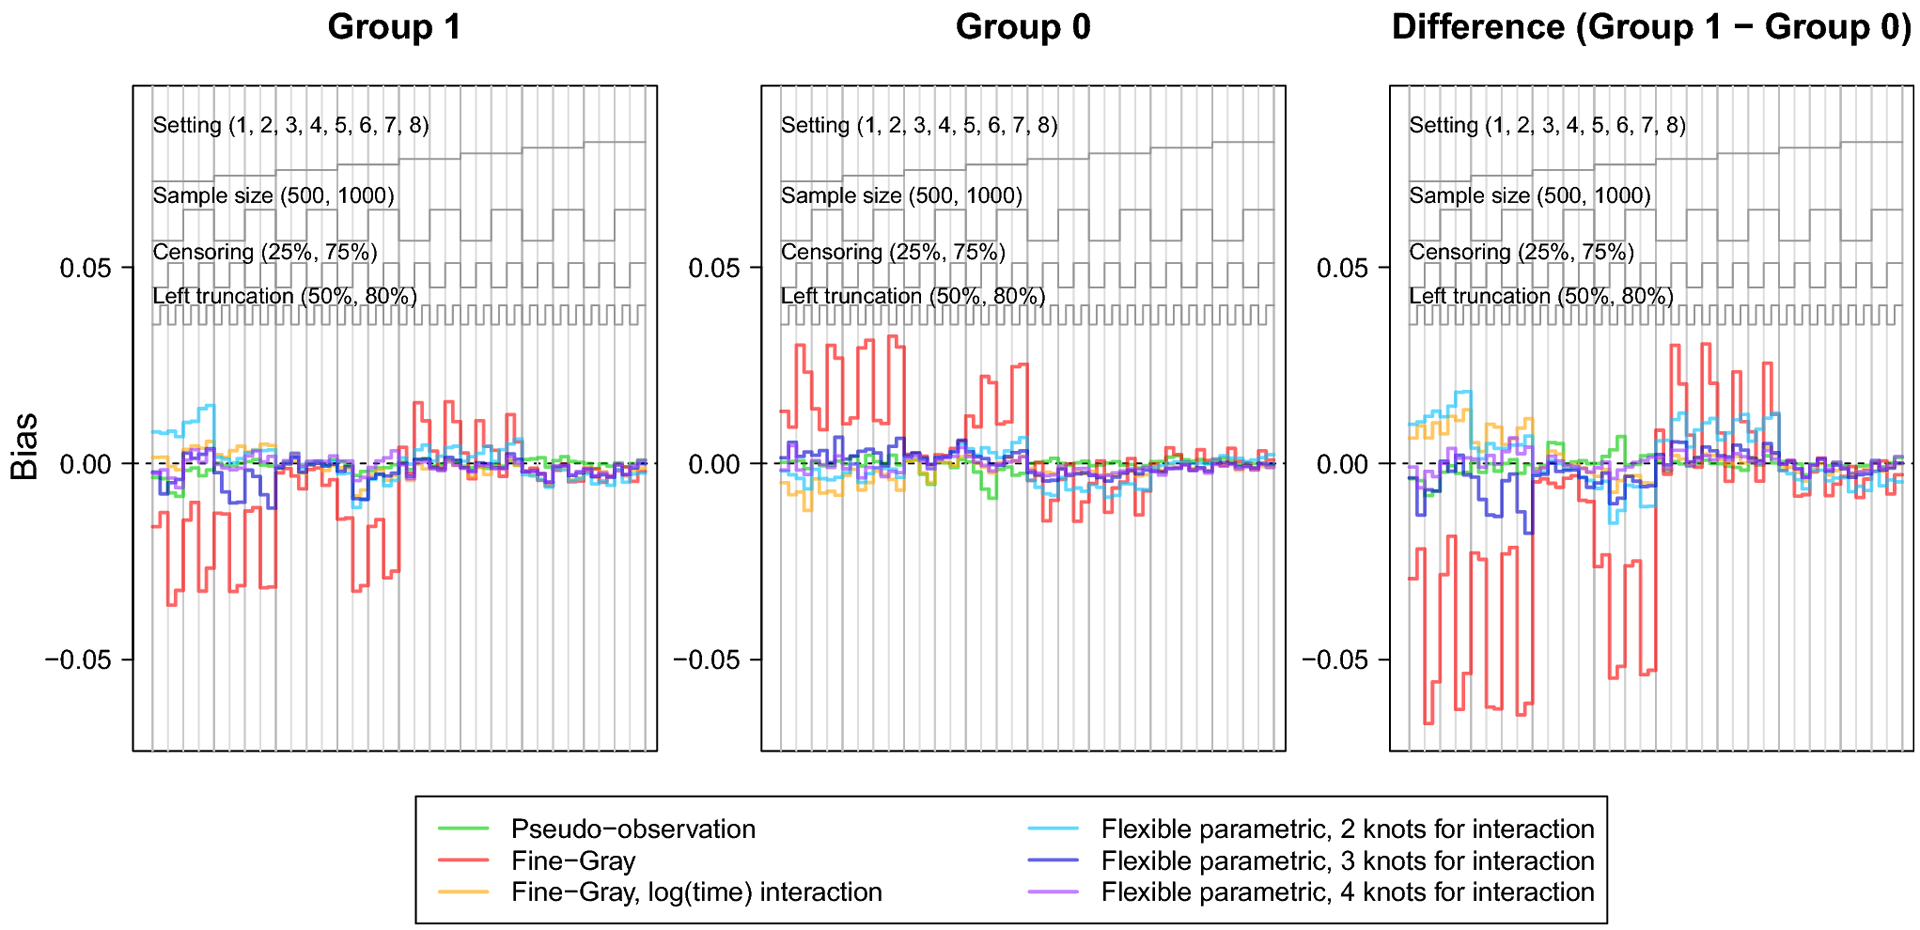
Fig. 1.

Nested loop plot showing the simulation study results: bias.
The legend at the top describes the organization of results by setting, sample size, censoring, and left truncation. Each vertical panel is a unique scenario, with a total of 64 scenarios.
