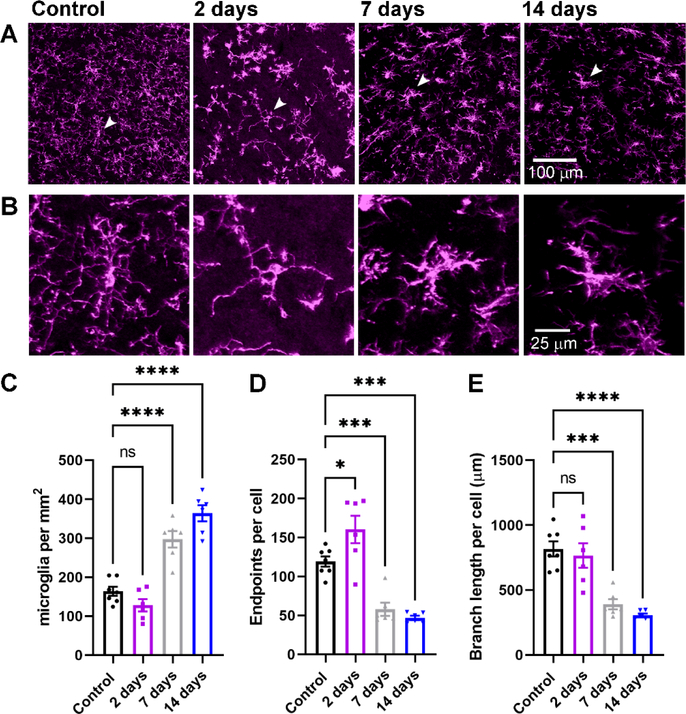
Figure 2. Evidence for microglia activation following bilateral enucleation.
A) Maximum intensity projection of the dLGN stained with an anti-Iba1 antibody to label microglia. B) Higher magnification images of the individual microglia identified by arrows in the images in A. C) Quantification of microglia cell body density in the dLGN. D) Quantification of microglia endpoints per cell. E) Quantification of microglia branch length per cell. *p<0.05, ***p<0.005, ****p<0.0001, Dunnett’s multiple comparison test. Control n = 7 mice; 2 days n = 6 mice; 7 days n = 6 mice; 14 days n = 6 mice.

