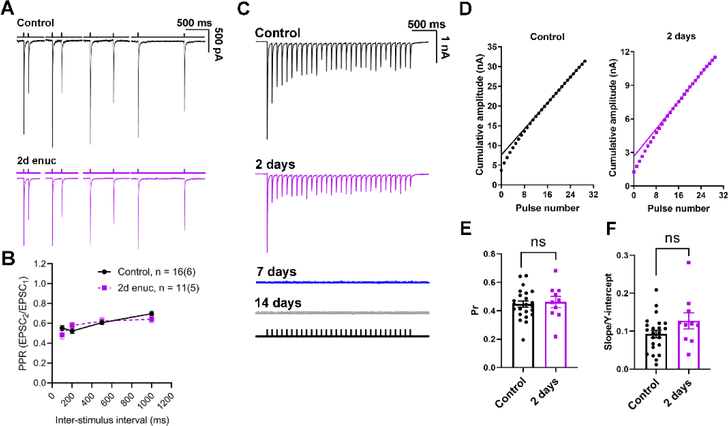
Figure 4. Presynaptic vesicle release probability at the retinogeniculate synapse does not change in response to bilateral enucleation.
A) Example traces of EPSCs recorded in TC neurons in response to pairs of stimuli applied to stimulate the RGC axons spaced at different time intervals (100 ms, 200 ms, 500 ms, and 1000 ms). The bathing solution was supplemented with γDGG (200 μM) and cyclothiazide (100 μM). B) Plot of paired pulse ratio at different stimulus intervals. Sample sizes are number of cells and (mice). There was no significant difference between control and enucleated at any time interval (nested t-test). C) Representative examples of excitatory post-synaptic current responses of TC neurons to a 10 Hz stimulus train at different time points following bilateral enucleation. The stimulus marker is shown below the traces. D) Cumulative EPSC amplitudes plotted against stimulus number with a linear fit of 15th to 30th data points extrapolated to the Y-axis. There was no detectable response at 7- or 14-day time points E) Quantification of release probability (Pr), measured as the ratio of the first EPSC to the Y-intercept. No significant difference was observed in the presynaptic vesicle release probability between the control (n = 23 cells from 7 mice) and the enucleated cohort at 2-days post enucleation (n = 10 cells from 4 mice, nested t-test). F) Slope of the linear fit, taken as a measure of vesicle pool replenishment rate and normalized to account for relative changes in EPSC size, was not significantly different between control and 2d post-enucleation (p>0.05, nested t-test).

