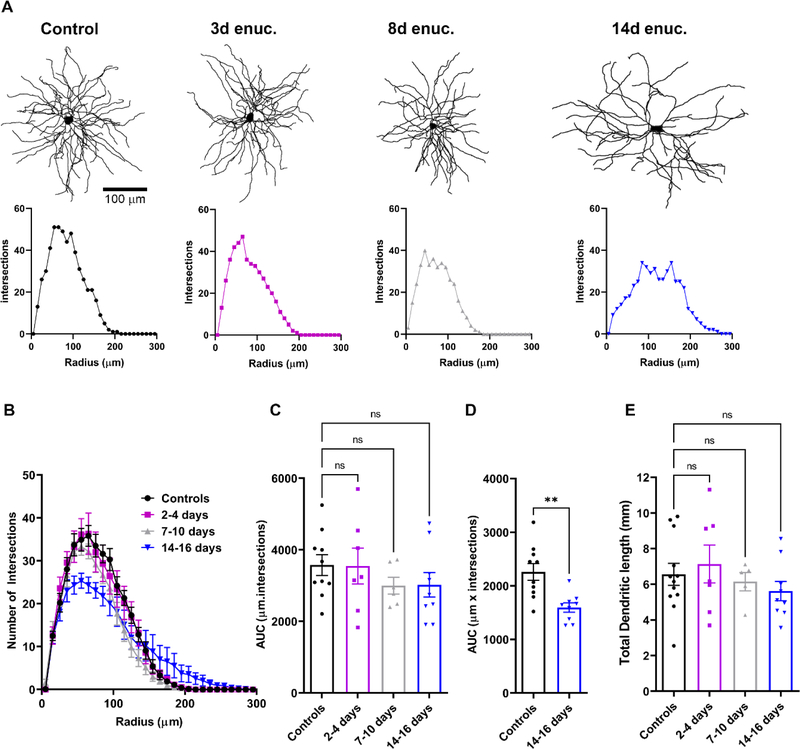
Figure 8. Reduction in dendritic complexity of TC neurons following bilateral enucleation.
A) Examples of dendritic reconstructions of Neurobiotin-filled TC neurons (upper panels) from control animals and enucleated cohorts and corresponding individual Sholl analysis plots (lower panels). B) Sholl analysis plot showing the number of dendritic intersections with distance from the soma. Analysis of area under the curve (AUC) obtained from the Sholl plot did not reveal any statistically significant differences between the dendritic structure (C, n.s. p>0.05 Dunnett’s multiple comparison). However, when the area under the curve for the dendritic structure between 35–105 μm away from the TC neuron somata (D), there was a notable decrease in the dendritic complexity at 14–16 days compared to controls (**p<0.01, unpaired t-test). E) There was no significant change in the total dendritic length of TC neurons in all animals (n.s. p>0.05 Dunnett’s multiple comparison).

