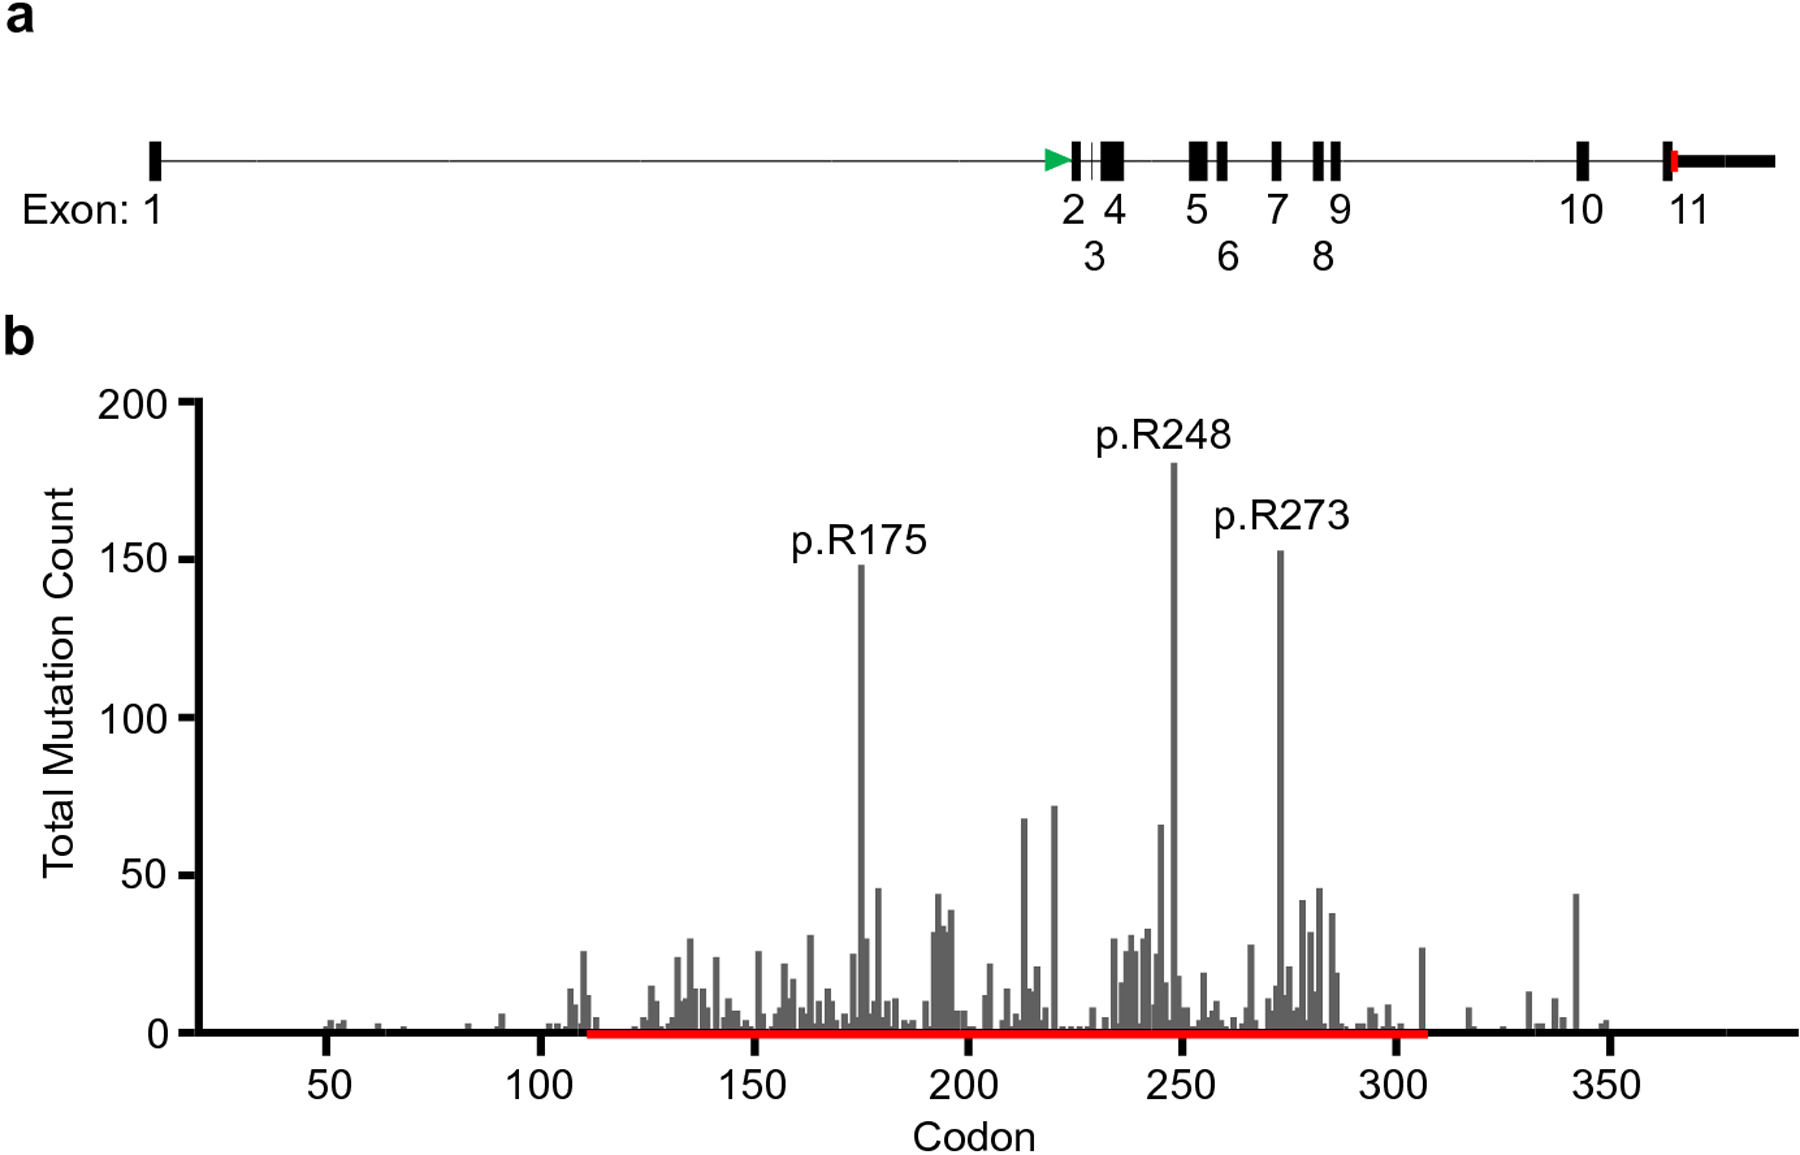
Figure 1: TP53 Gene Structure and Mutation Frequency.

(a). A diagram of the intron/exon structure of TP53 is drawn to scale. A green arrow denotes the exon containing the start codon and a red arrow denotes the exon containing the stop codon.(b). The frequency of somatic TP53 mutations by codon is plotted. Exons 5 through 8 are denoted by a red line. Intronic mutations affecting splicing are not included. The figure was created in GraphPad Prism 8.
